
DS Adaptive PriceLine
A self-anchoring replacement for NinjaTrader's native price line that re-derives its geometry every frame, from the live candle to the price axis.
- Always on the candle
- Bar-close countdown
- Timezone-proof clock
- Follows Oracle's colour
Risk disclosureThese are screen recordings of the software, not a performance record. Futures trading carries substantial risk of loss and is not suitable for every investor, and hypothetical or simulated results have inherent limitations that may differ materially from live trading. Read them in full.
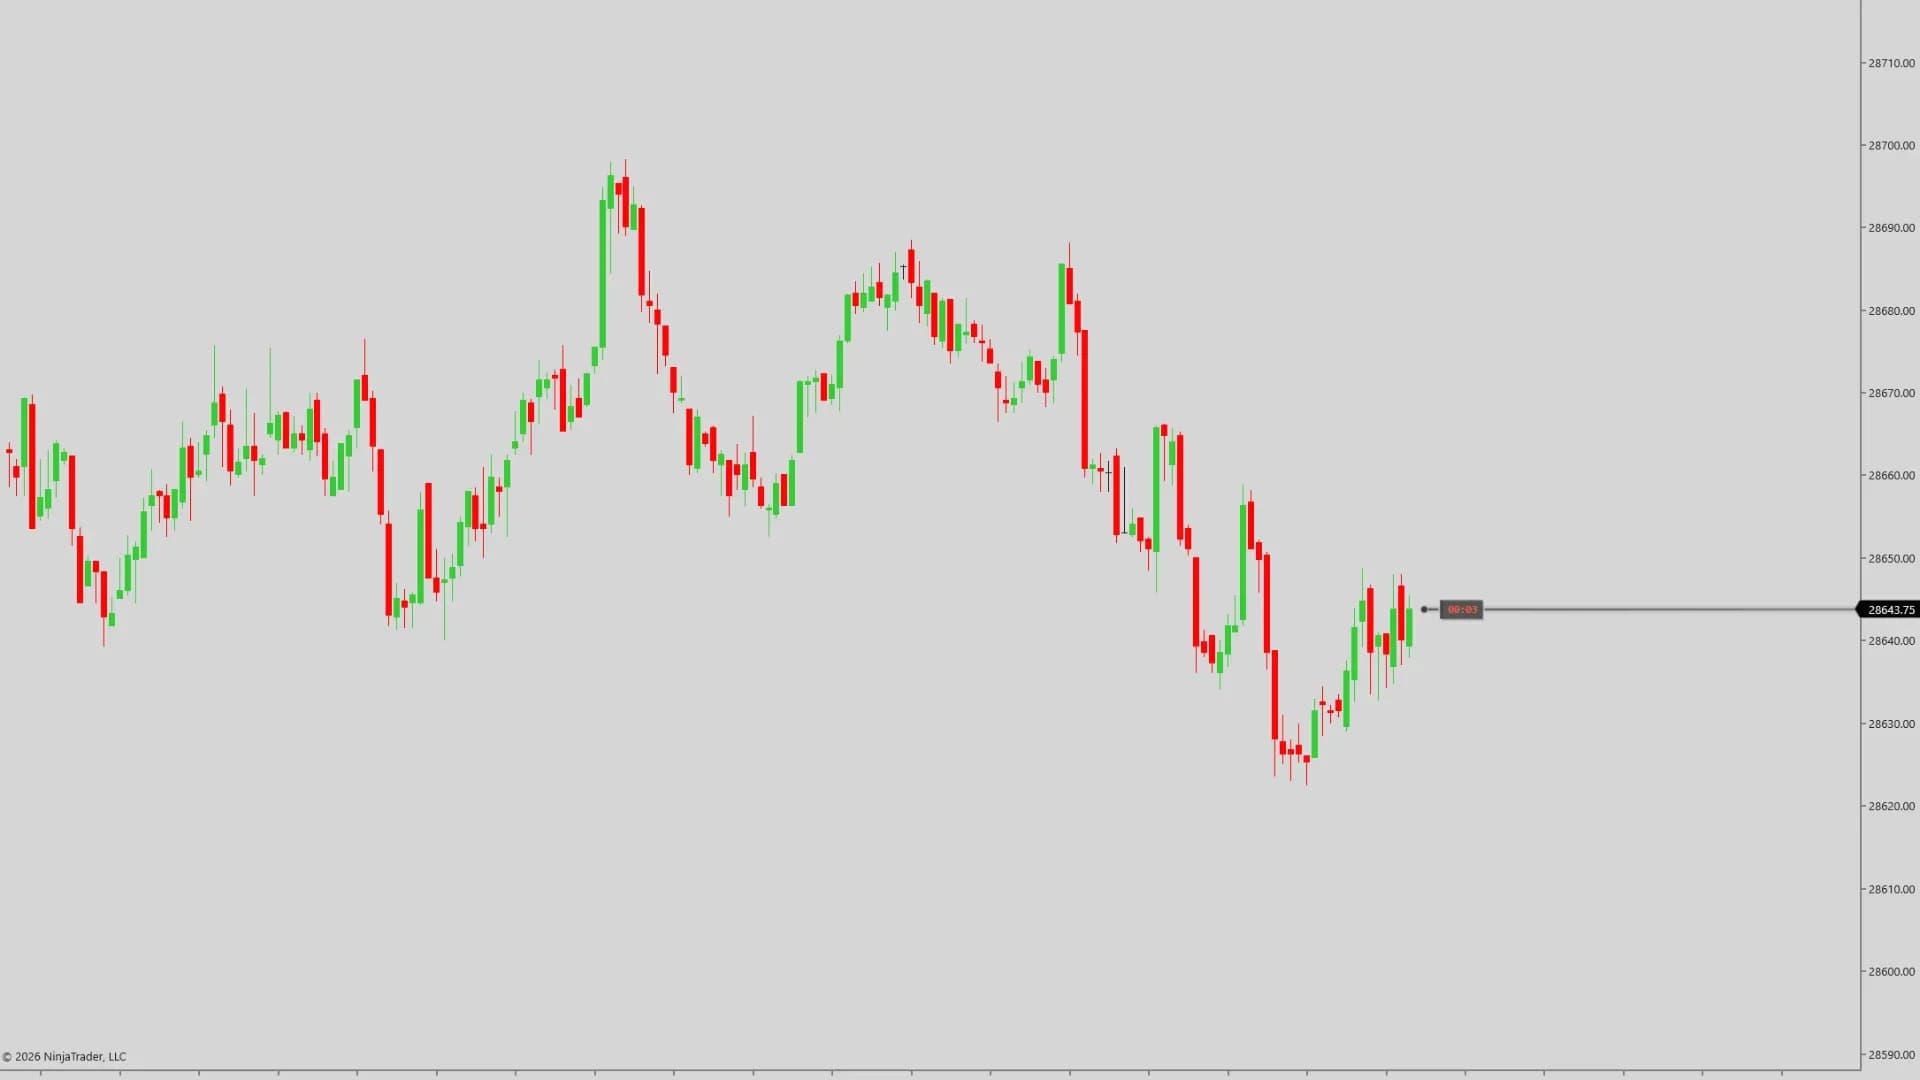
The price line re-anchoring as the candle moves
How it helps
- Type
- Indicator
- Category
- Chart Essentials
- Platform
- NinjaTrader 8
The native line starts at a fixed percentage of panel width, so it drifts off the candle the moment you scroll, zoom or change your right margin. This one anchors to the actual candle on every render frame, adds a soft glow and anchor circle, and carries a live bar-close countdown that rides the line.
Free
Yours to keep. Not a trial, and it does not expire.
Opening soon. Joining costs nothing and charges nothing — you are told the day it opens.
DS Universe tools are charting and research software for educational and informational purposes. They are not investment advice and no output is a forecast or a guarantee of any result. Trading futures and other leveraged instruments carries substantial risk of loss and is not suitable for every investor.
In detail
NinjaTrader's price line drifts off the candle the moment you scroll, zoom or change your margin.
This one re-derives its geometry on every render frame — anchored to the live candle, running to the axis marker, exactly where it belongs no matter what you do to the chart.
The details
- A bar-close countdown riding the line, amber in the last seconds, red at the end
- A timezone-proof clock learned from the live feed, not your PC — correct across DST
- Counts down on Heiken-Ashi and Volumetric charts too
- Glow, rounded caps and an anchor circle, painted behind the bars so it never covers price
Running DS Oracle? The line can mirror Oracle's live trend colour. The link is optional — this runs perfectly alone.

Test it on your own charts first.
Four screenshots and a paragraph are not enough to judge an indicator on. Watch it work in your own instrument, on your own timeframe, before it goes anywhere near a live account. Both ways of doing that are free.
- 01
Replay a session you have already seen
Market Replay runs a past session back tick by tick, at whatever speed you like. You get to watch DS Adaptive PriceLine print in conditions you remember, and pause on the bars where it mattered.
- 02
Then trade it forward, on the simulator
Replay shows you the past with the ending already known. The simulator does not — it runs live, in real time, on real prices, with nothing at stake. That is where you find out whether you can actually act on what you are seeing.
A simulated fill is not a live fill. Replay and the simulator cannot reproduce real queue position, slippage, or what it feels like to hold a position with money on it, and results from either may differ materially from live trading. Test to learn how a tool behaves — not to estimate what it might return.
More indicators
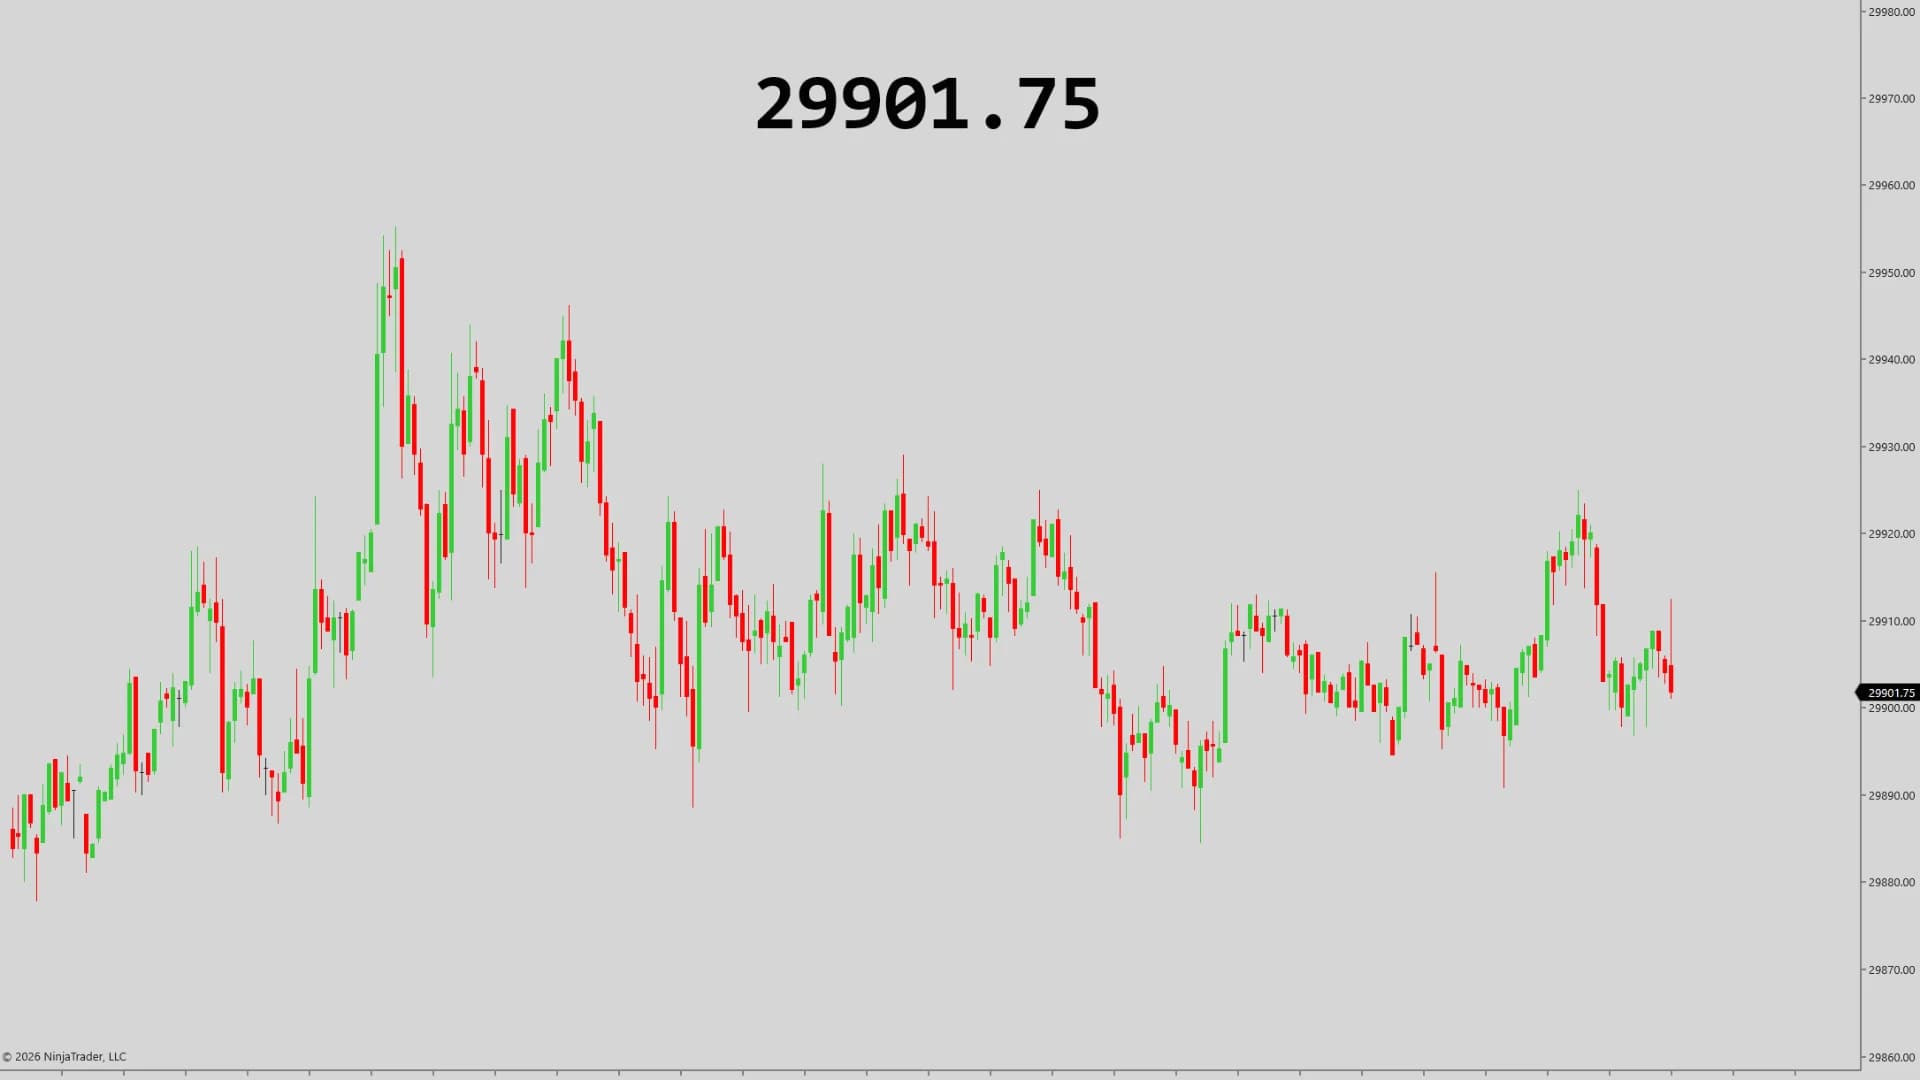
Chart Essentials
DS Chart Price
A large animated last-price readout that blinks green on upticks and red on downticks, turns amber when the tape goes choppy, and carries a three-level alert engine.
Learn more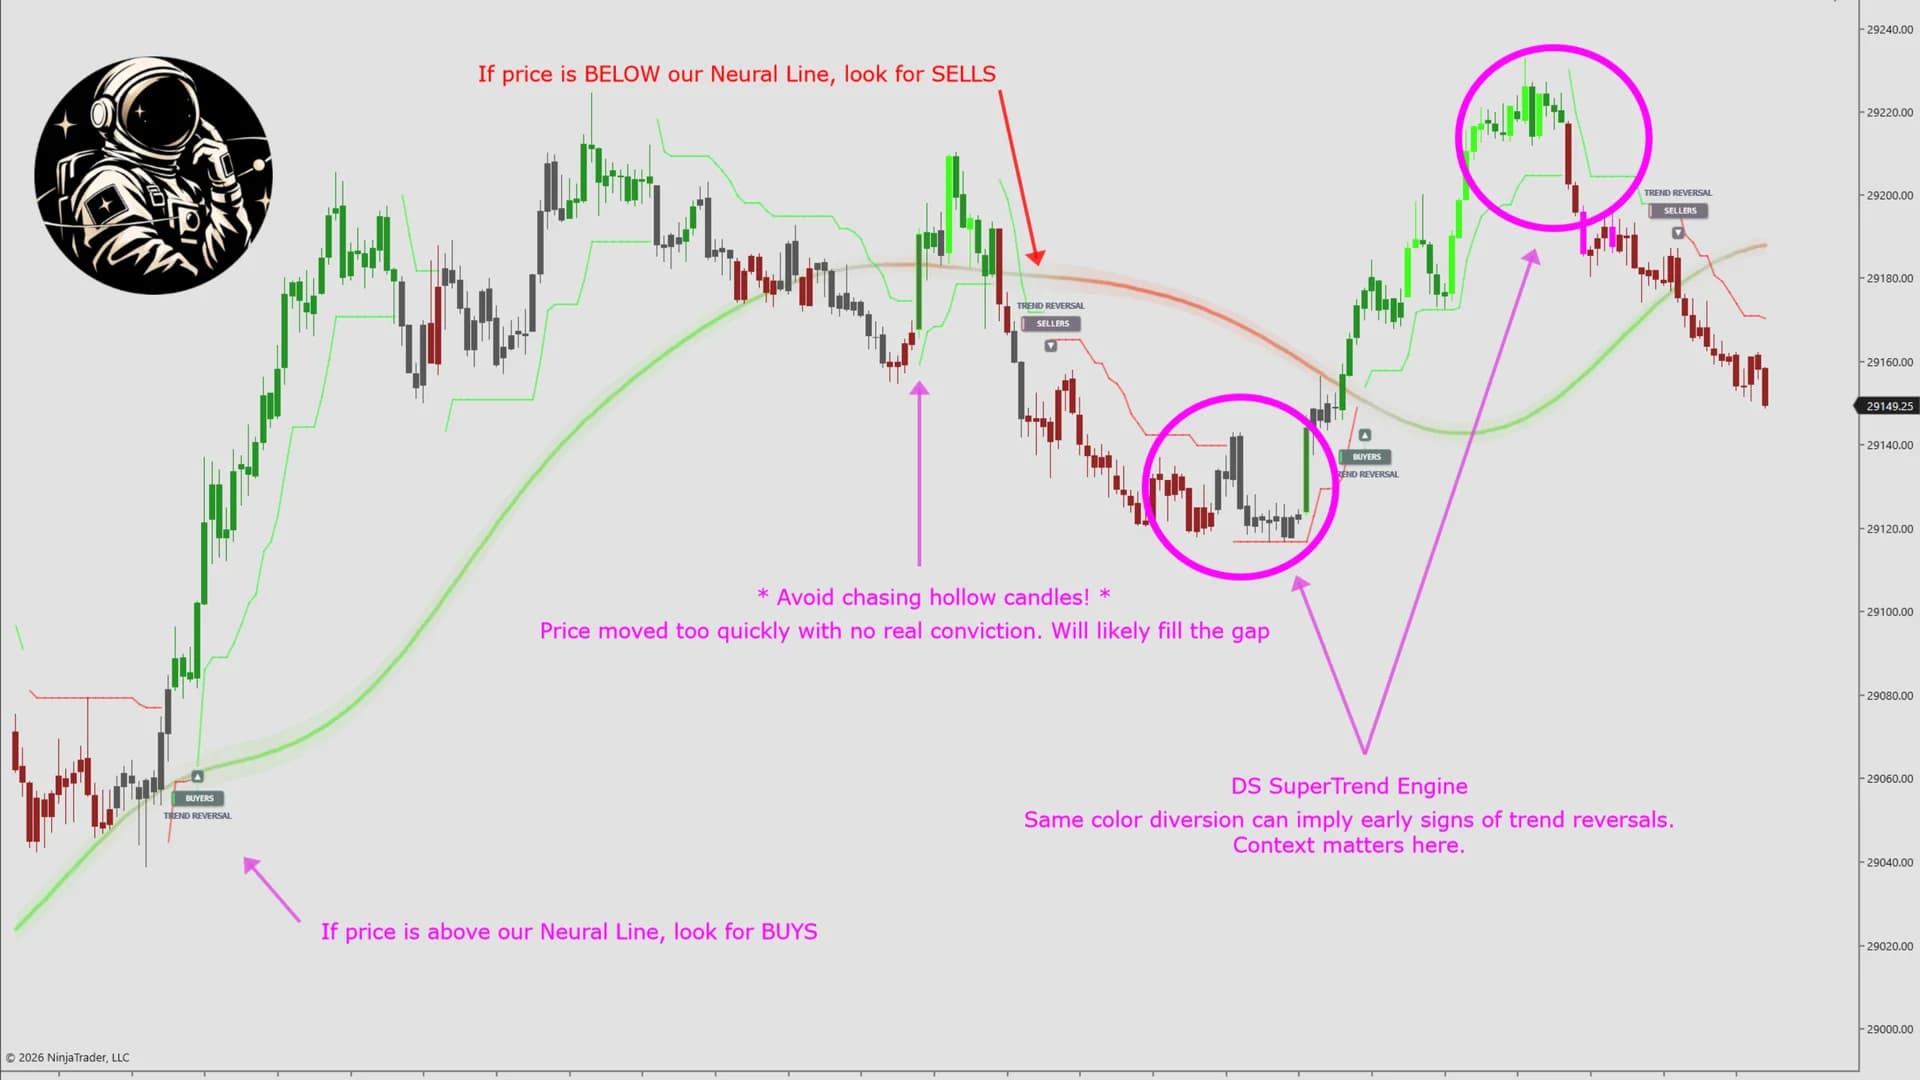
AI Trend & Signals
DS Oracle
A machine-learning-confirmed trend engine – every SuperTrend flip validated by AI, with a Neural Line setting which side you are allowed to trade.
Learn more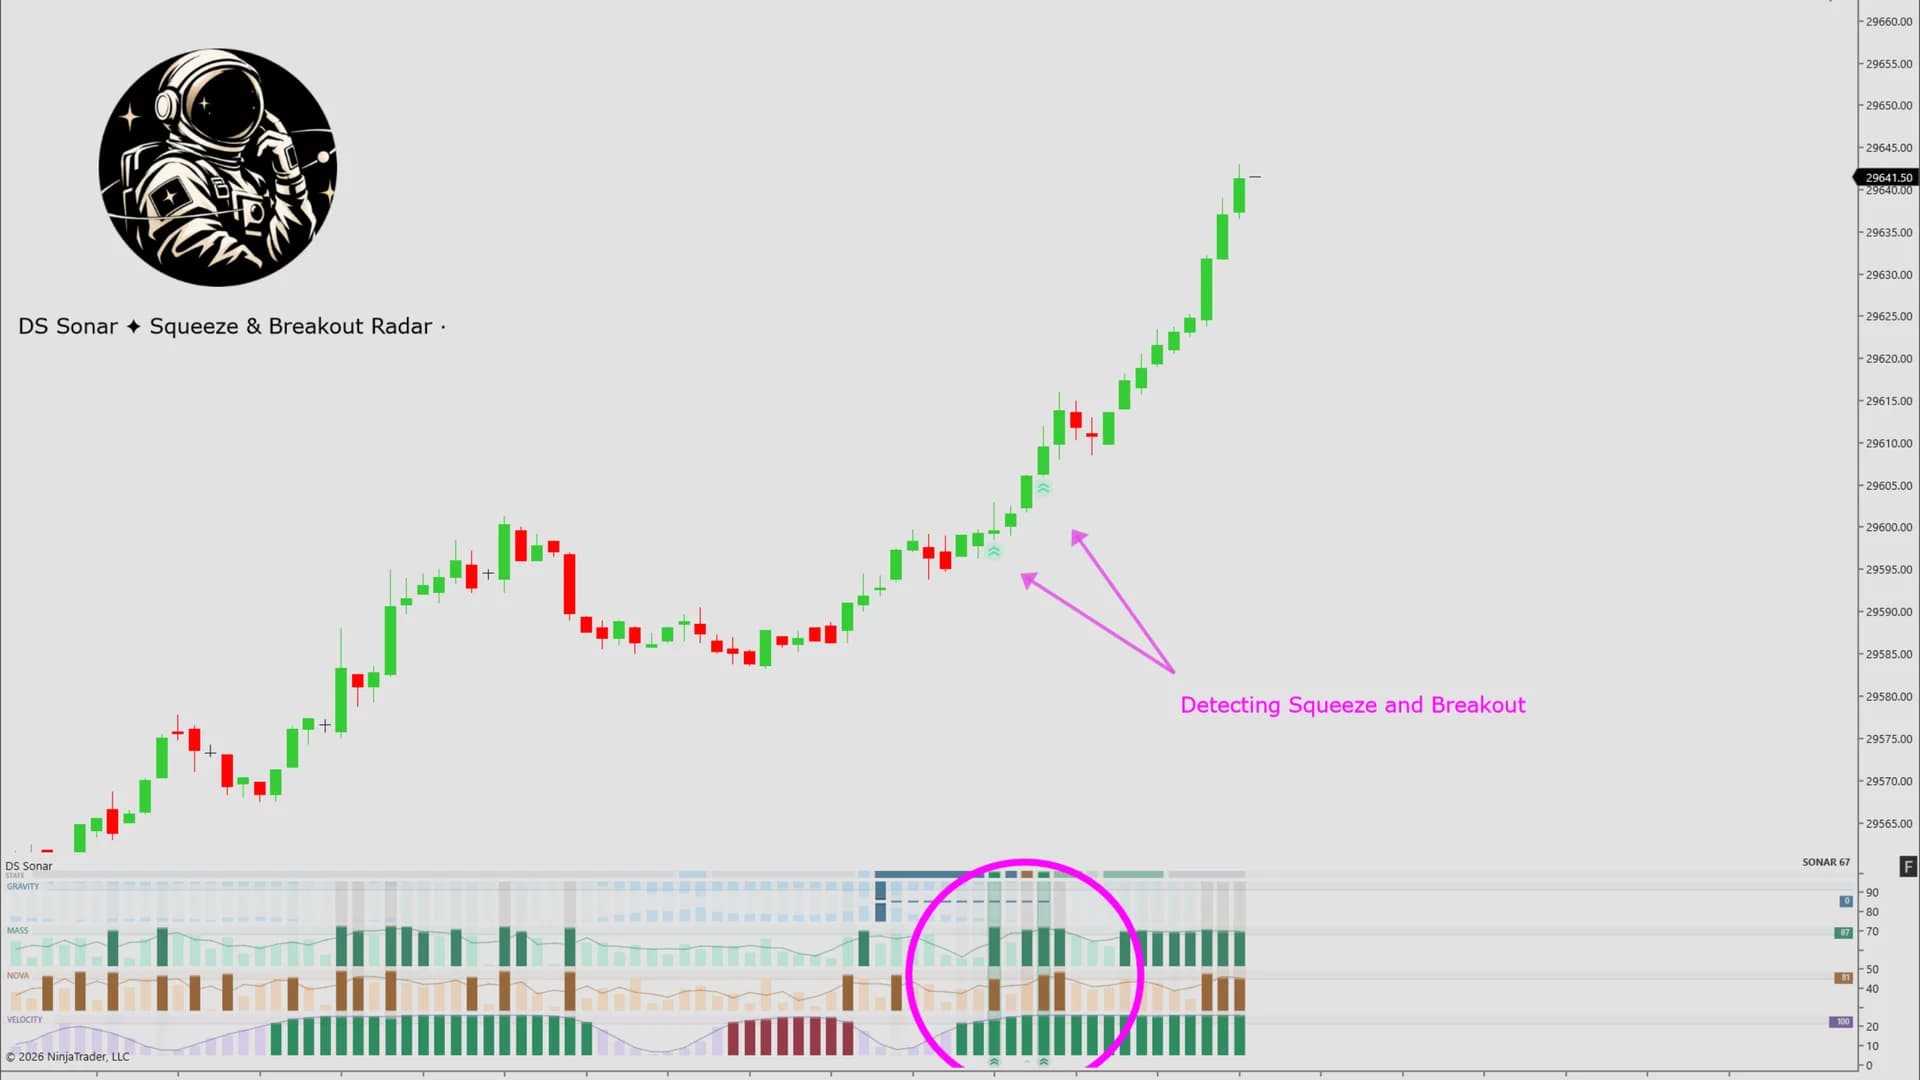
Squeeze & Volatility Radar
DS Sonar
A squeeze radar: four channels – compression, volume, range expansion and momentum – each scored 0-100, answering whether a move is loading and igniting now.
Learn more