
DS Sonar
A squeeze radar: four channels – compression, volume, range expansion and momentum – each scored 0-100, answering whether a move is loading and igniting now.
- Four lanes, one 0-100 scale
- Ignition needs all four
- Same numbers on any chart
- It tells you when it is spent
Risk disclosureChart pictures are illustrations of the software, not a performance record. Futures trading carries substantial risk of loss and is not suitable for every investor, and hypothetical or simulated results have inherent limitations that may differ materially from live trading. Read them in full.
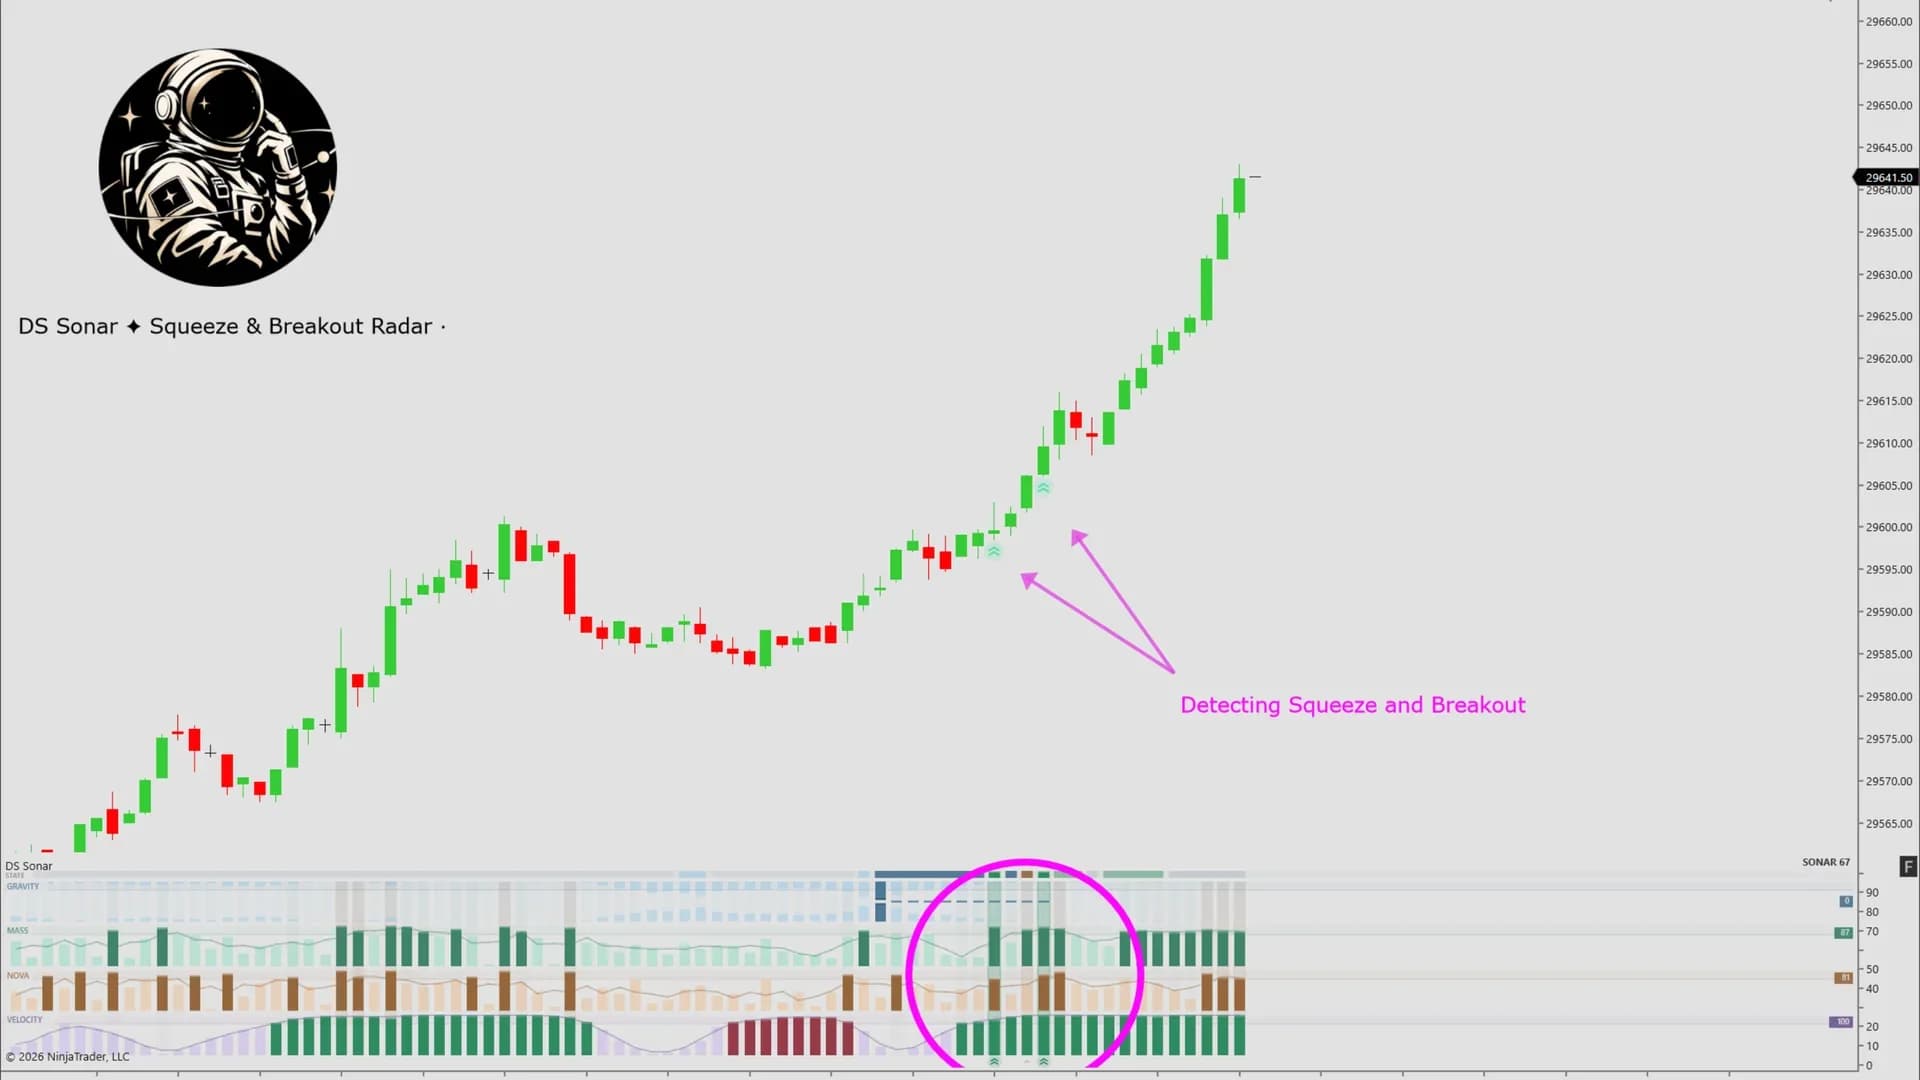
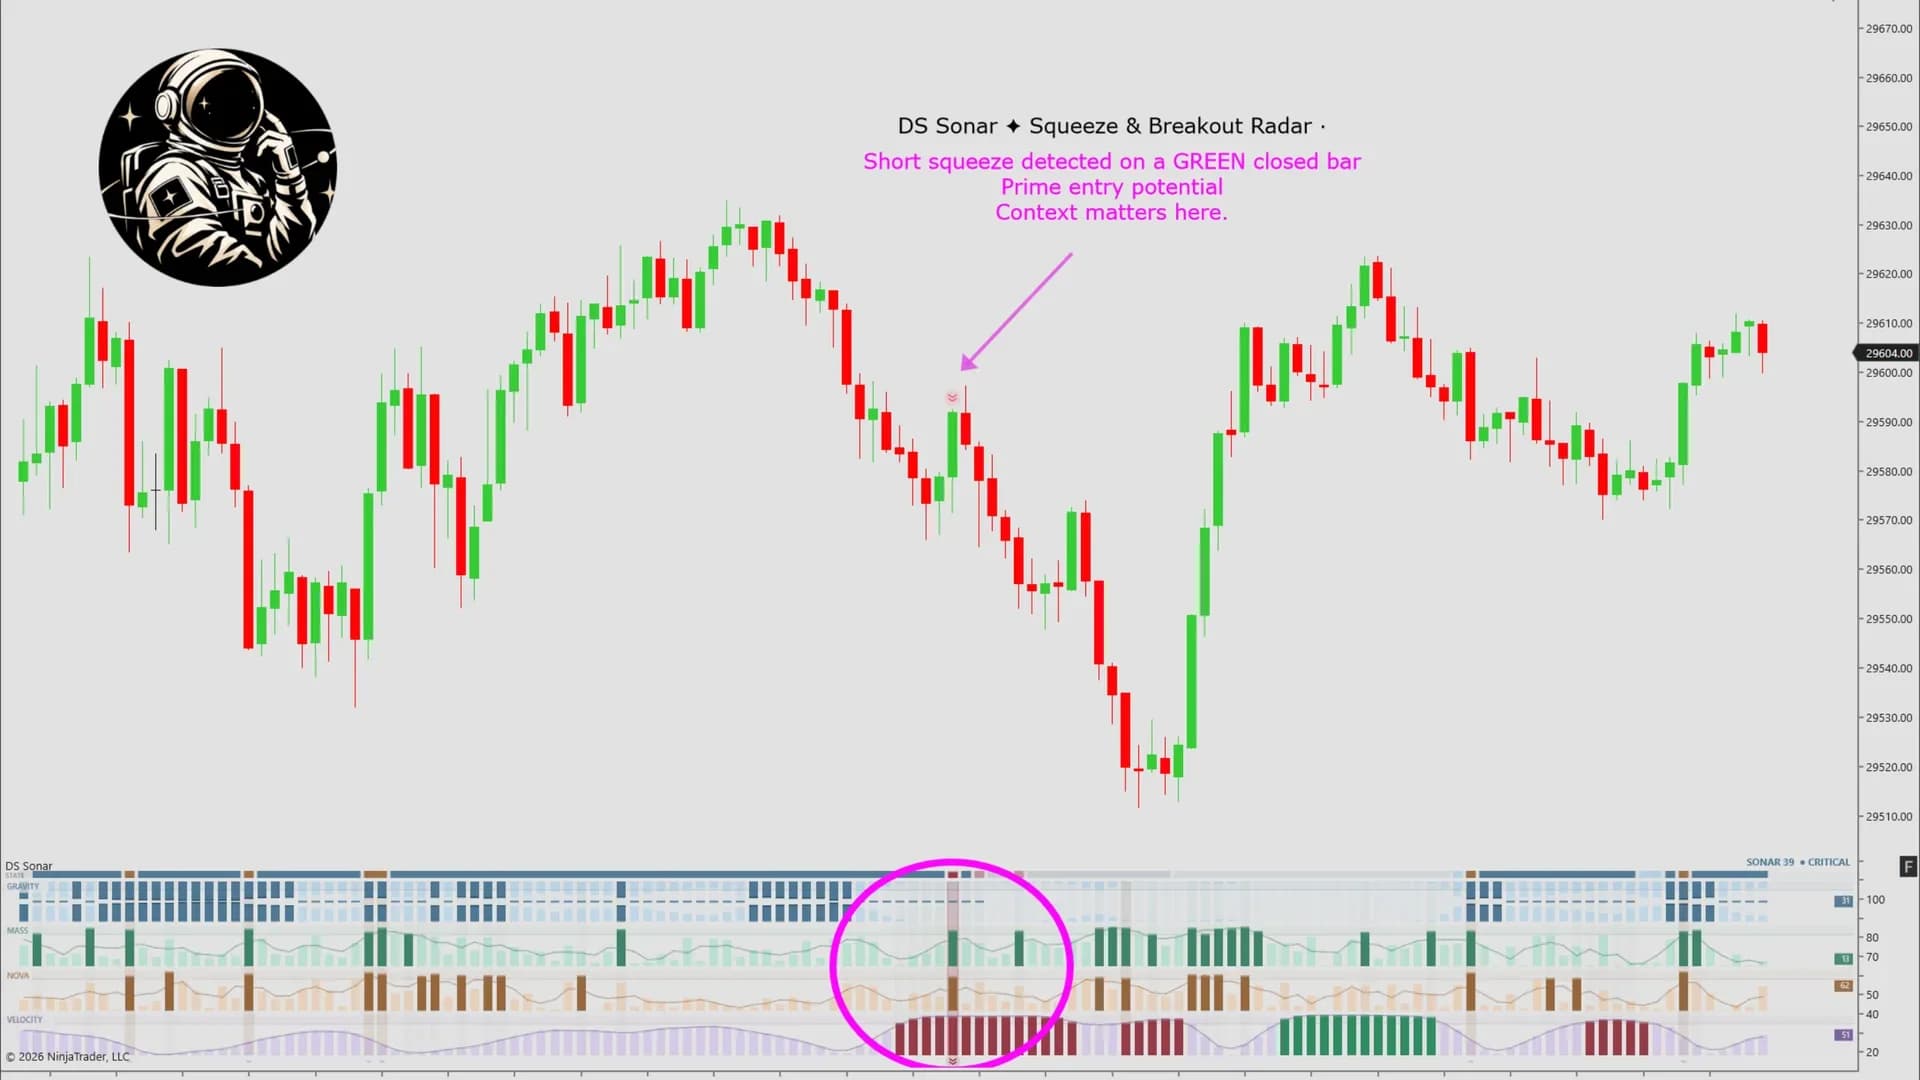
The squeeze and breakout radar under a trending chart
How it helps
- Type
- Indicator
- Category
- Squeeze & Volatility Radar
- Platform
- NinjaTrader 8
Ordinary squeeze tools tell you a squeeze is on and nothing else – no idea whether volume, range and momentum are backing it, and nothing at all once the move starts. DS Sonar ranks each of the four ingredients against its own history, only calls an ignition when all four line up, and then keeps reporting through the move, so you can tell a breakout that is still running from one that is finished.
One payment, not a subscription. Later versions included.
Opening soon. Joining costs nothing and charges nothing — you are told the day it opens.
DS Universe tools are charting and research software for educational and informational purposes. They are not investment advice and no output is a forecast or a guarantee of any result. Trading futures and other leveraged instruments carries substantial risk of loss and is not suitable for every investor.
In detail
Every squeeze tool says a move is coming. This one says when it fires — and when it is spent.
Four channels, each scored 0–100 against its own history, so the same thresholds read the same on MNQ 1-minute or a daily chart.
The four lanes
- GRAVITY — compression, made continuous instead of an on/off dot
- MASS — participation, this bar's volume against what it should be
- NOVA — expansion, this bar's range against what it should be
- VELOCITY — momentum, and whether it is still building
Ignition needs all four at once, which is why it is rare. One short is a FLARE, and you see it coming. Above the lanes a state ribbon carries the whole cycle — COILING, CRITICAL, FLARE, IGNITION, EXPANDING, COOLING — so a move that is still running never looks like one that is over. Closed-bar: it does not repaint.

Test it on your own charts first.
Four screenshots and a paragraph are not enough to judge an indicator on. Watch it work in your own instrument, on your own timeframe, before it goes anywhere near a live account. Both ways of doing that are free.
- 01
Replay a session you have already seen
Market Replay runs a past session back tick by tick, at whatever speed you like. You get to watch DS Sonar print in conditions you remember, and pause on the bars where it mattered.
- 02
Then trade it forward, on the simulator
Replay shows you the past with the ending already known. The simulator does not — it runs live, in real time, on real prices, with nothing at stake. That is where you find out whether you can actually act on what you are seeing.
A simulated fill is not a live fill. Replay and the simulator cannot reproduce real queue position, slippage, or what it feels like to hold a position with money on it, and results from either may differ materially from live trading. Test to learn how a tool behaves — not to estimate what it might return.
More indicators
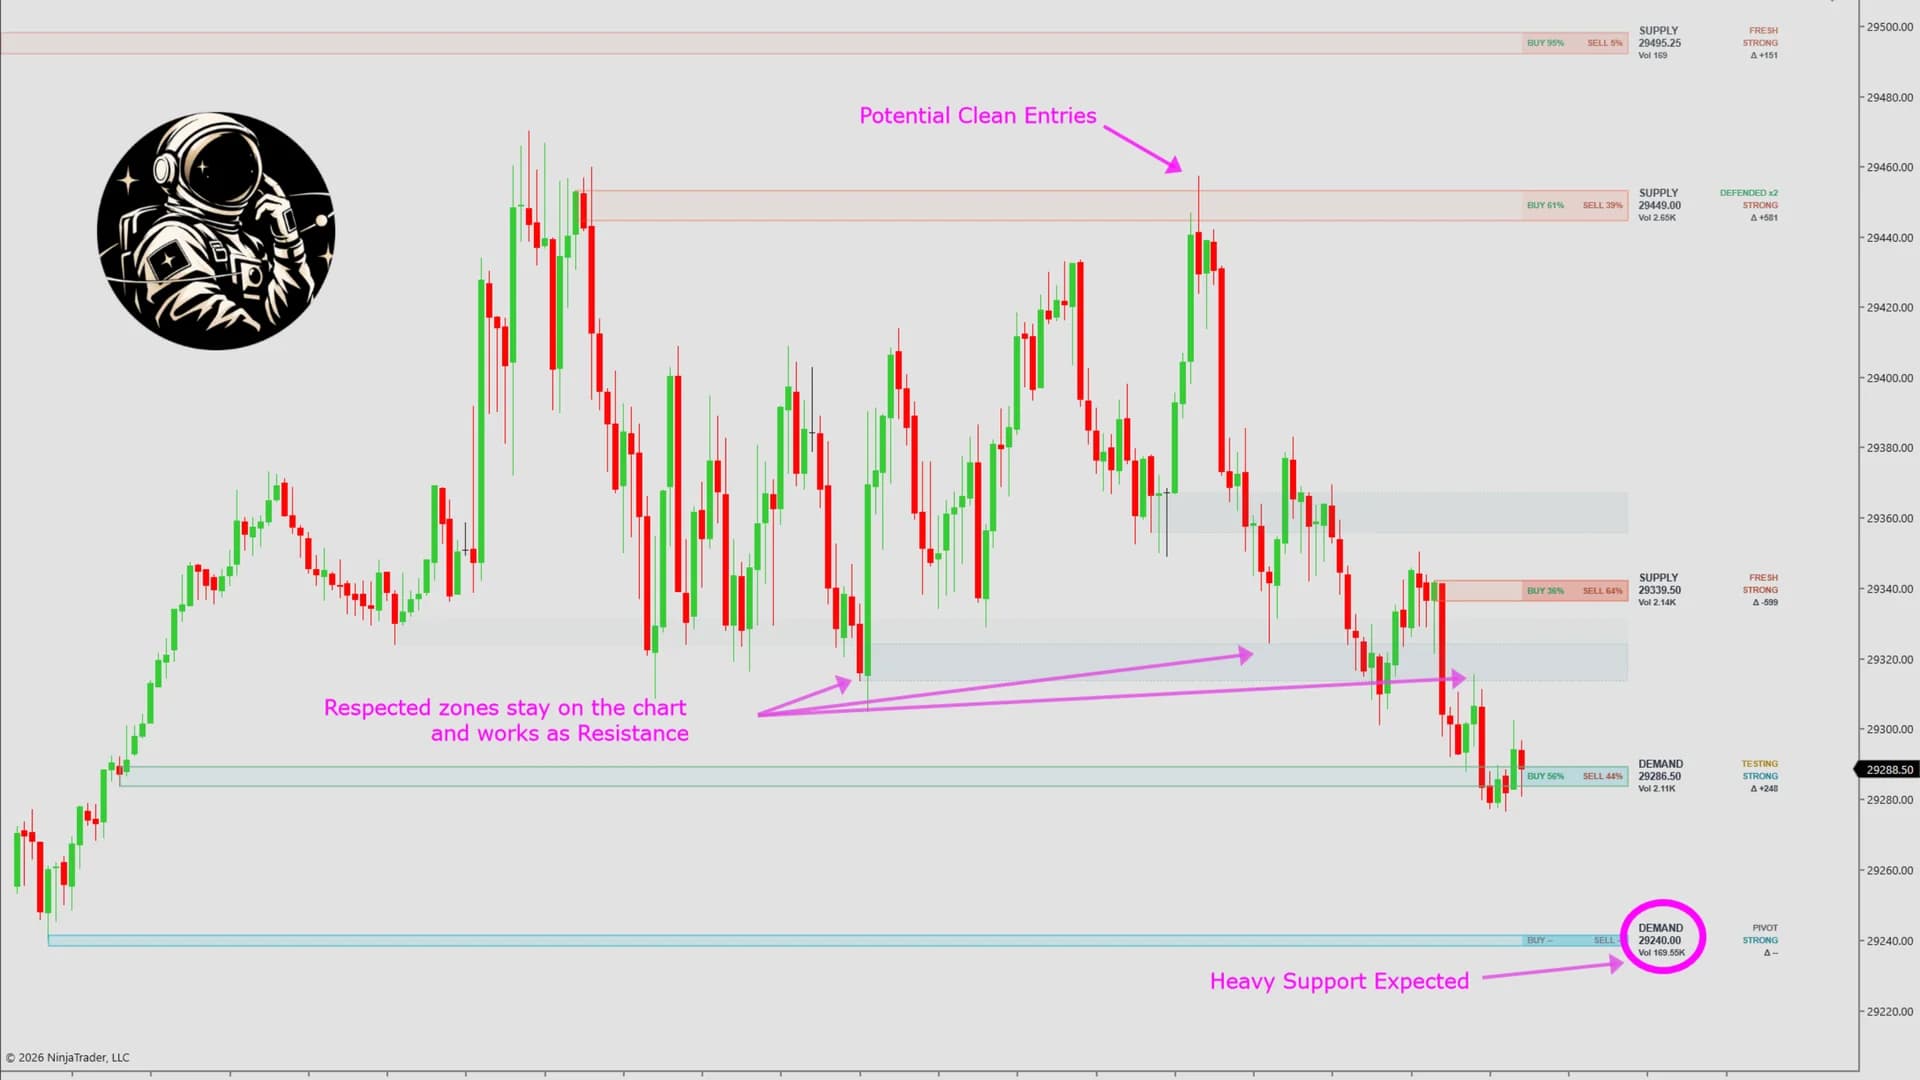
Structure & Levels
DS Zones
Structural confluence zones fusing pivots, volume supply/demand and real order flow – and tracking what price does to every zone, live.
Learn more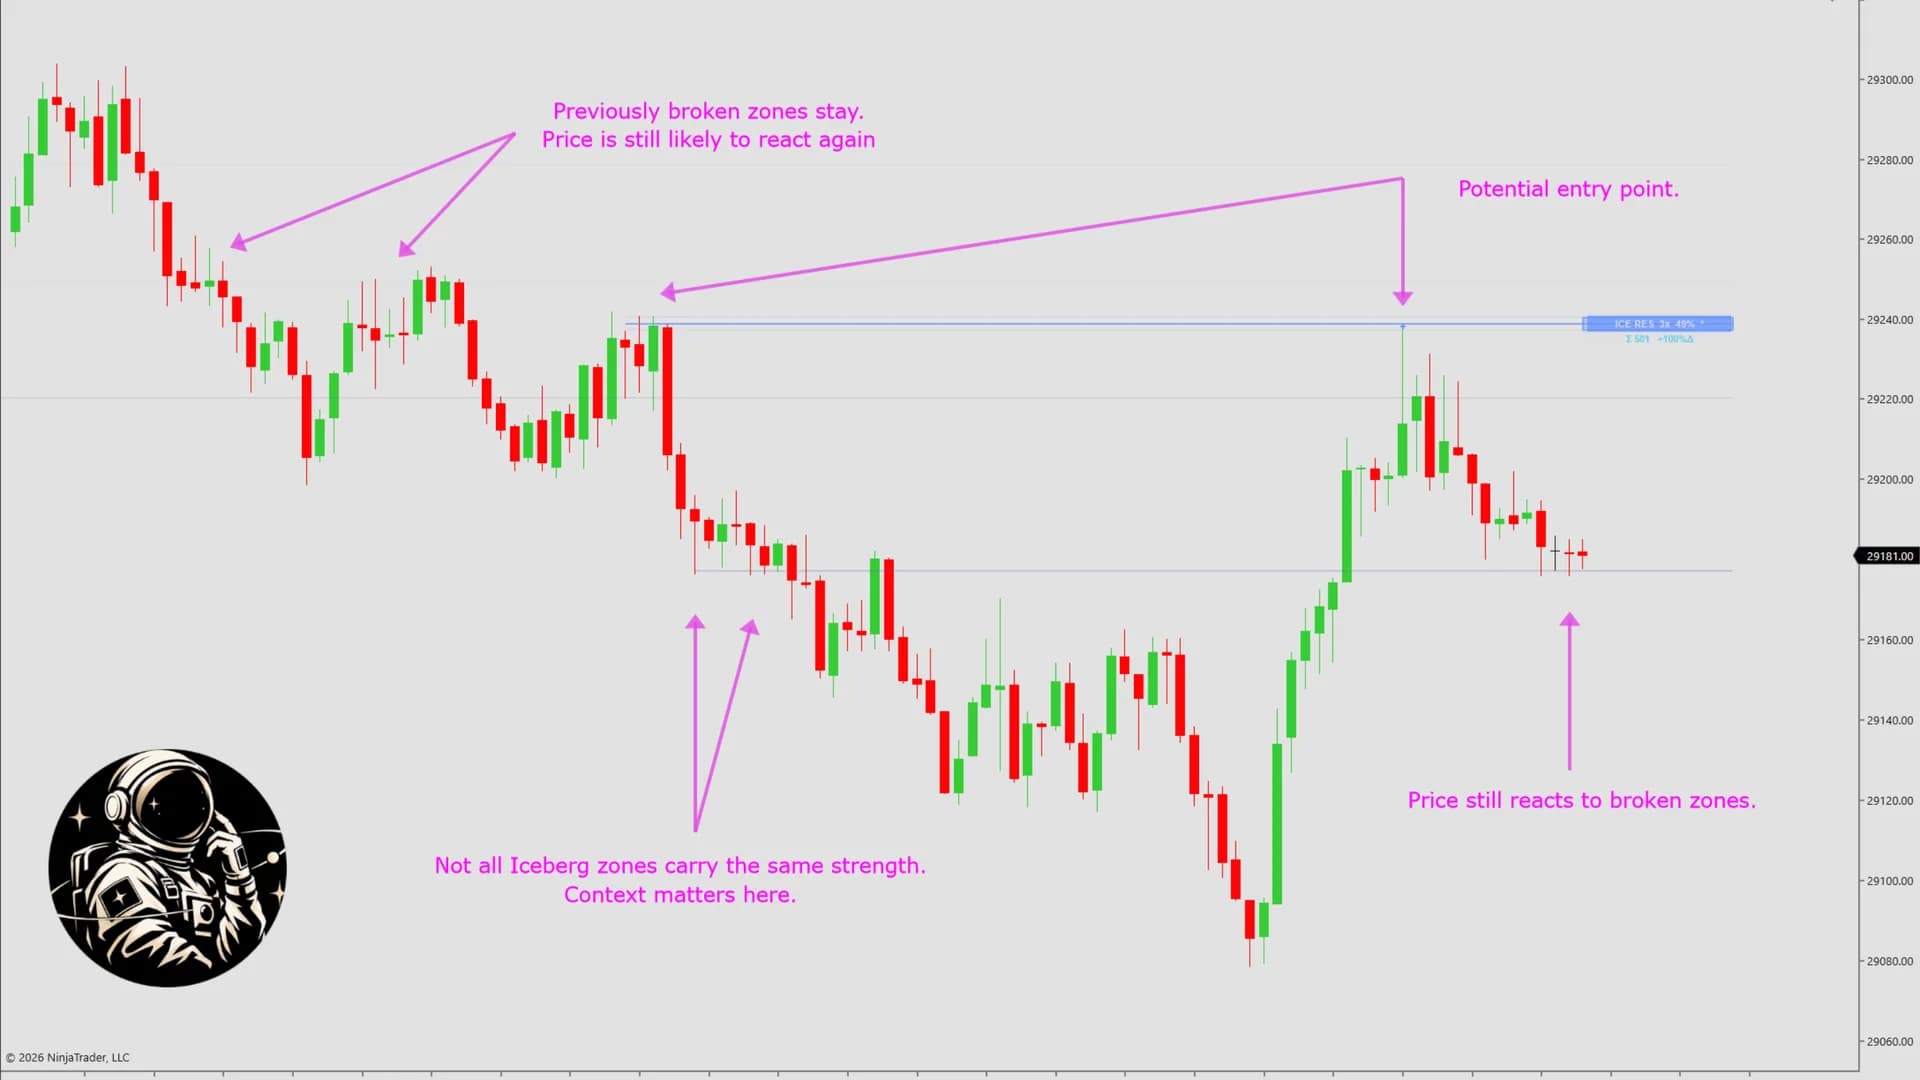
Liquidity & Absorption
DS Iceberg
An institutional iceberg detector: the hidden refill limit orders that absorb aggression and quietly refuse to let price through.
Learn more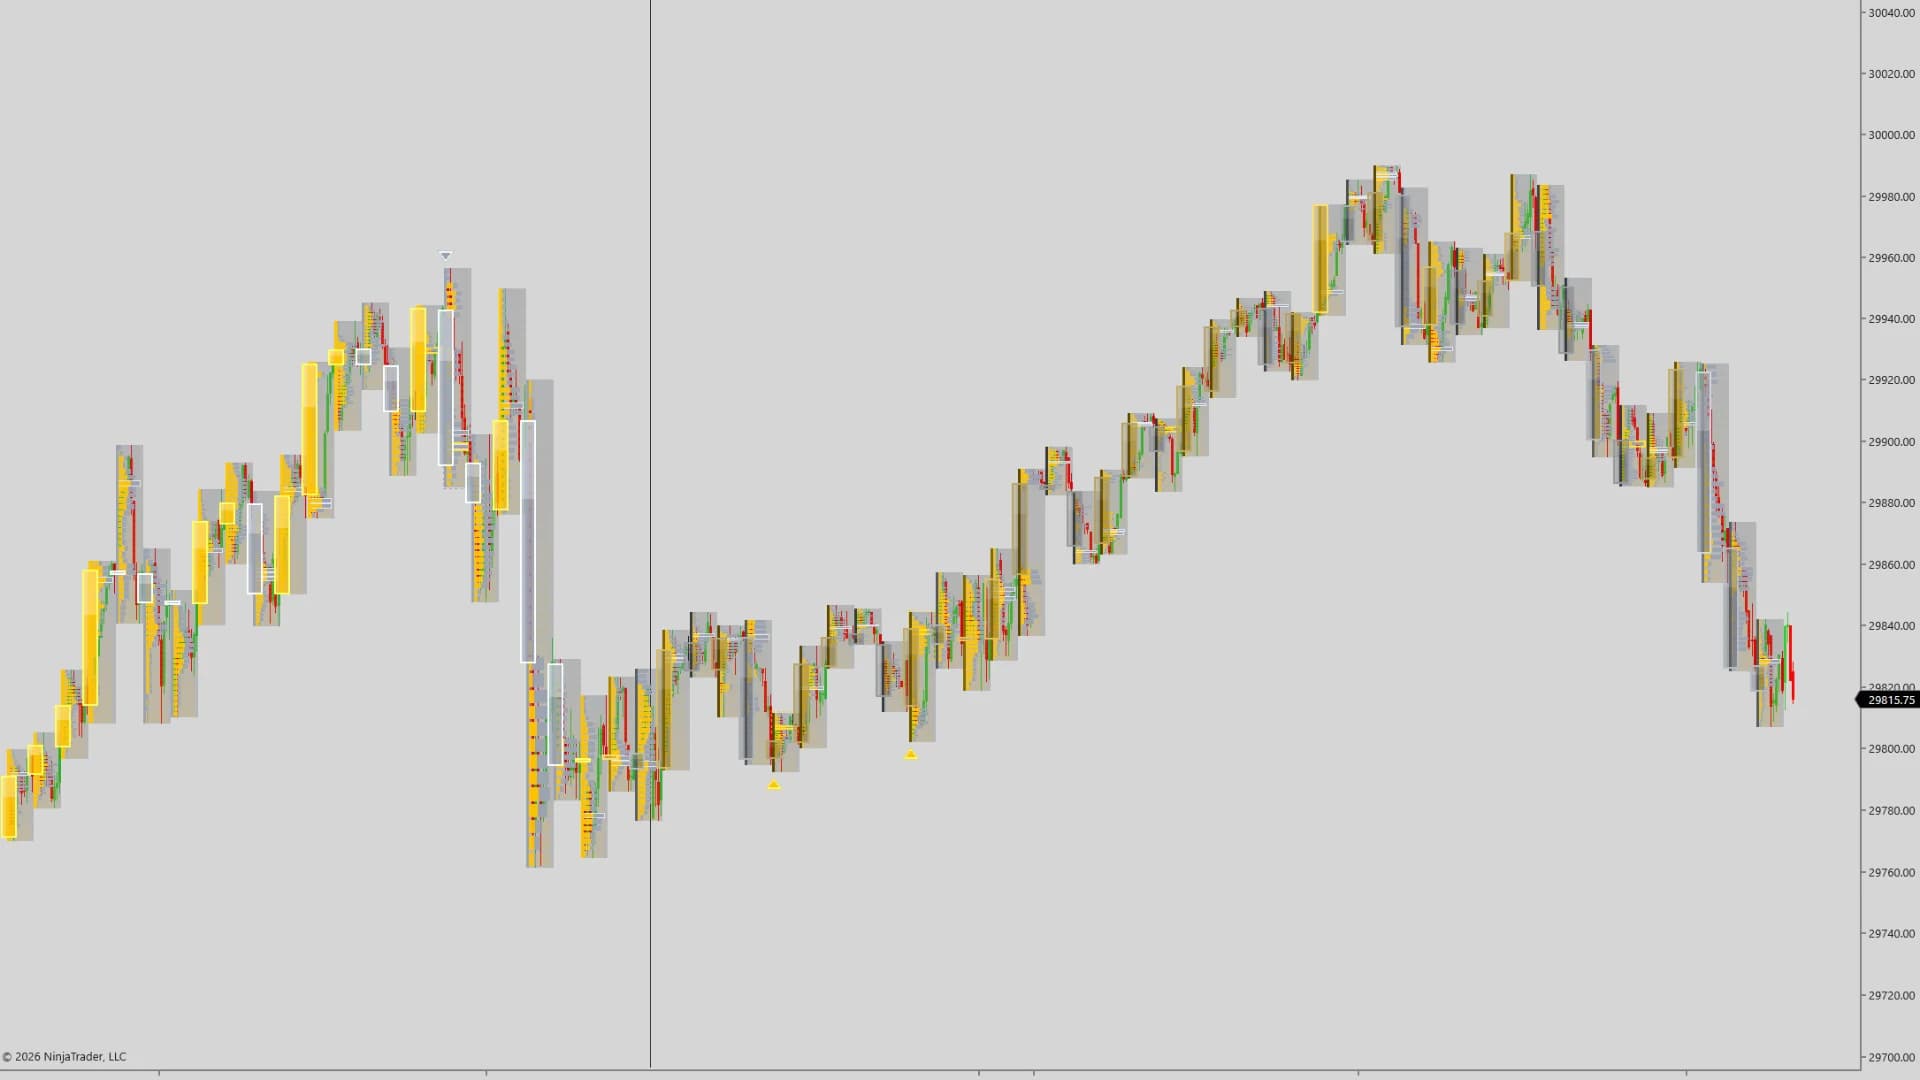
Order Flow & Volume Profile
DS Flow
A volume-flow footprint that x-rays groups of candles into a volume-by-price profile – where the market did business, and who was pressing.
Learn more