
DS Flow
A volume-flow footprint that x-rays groups of candles into a volume-by-price profile – where the market did business, and who was pressing.
- Buy vs sell at every price
- HVN and FIGHT nodes
- Volume-backed reversals
- Session profile mode
Risk disclosureThese are screen recordings of the software, not a performance record. Futures trading carries substantial risk of loss and is not suitable for every investor, and hypothetical or simulated results have inherent limitations that may differ materially from live trading. Read them in full.
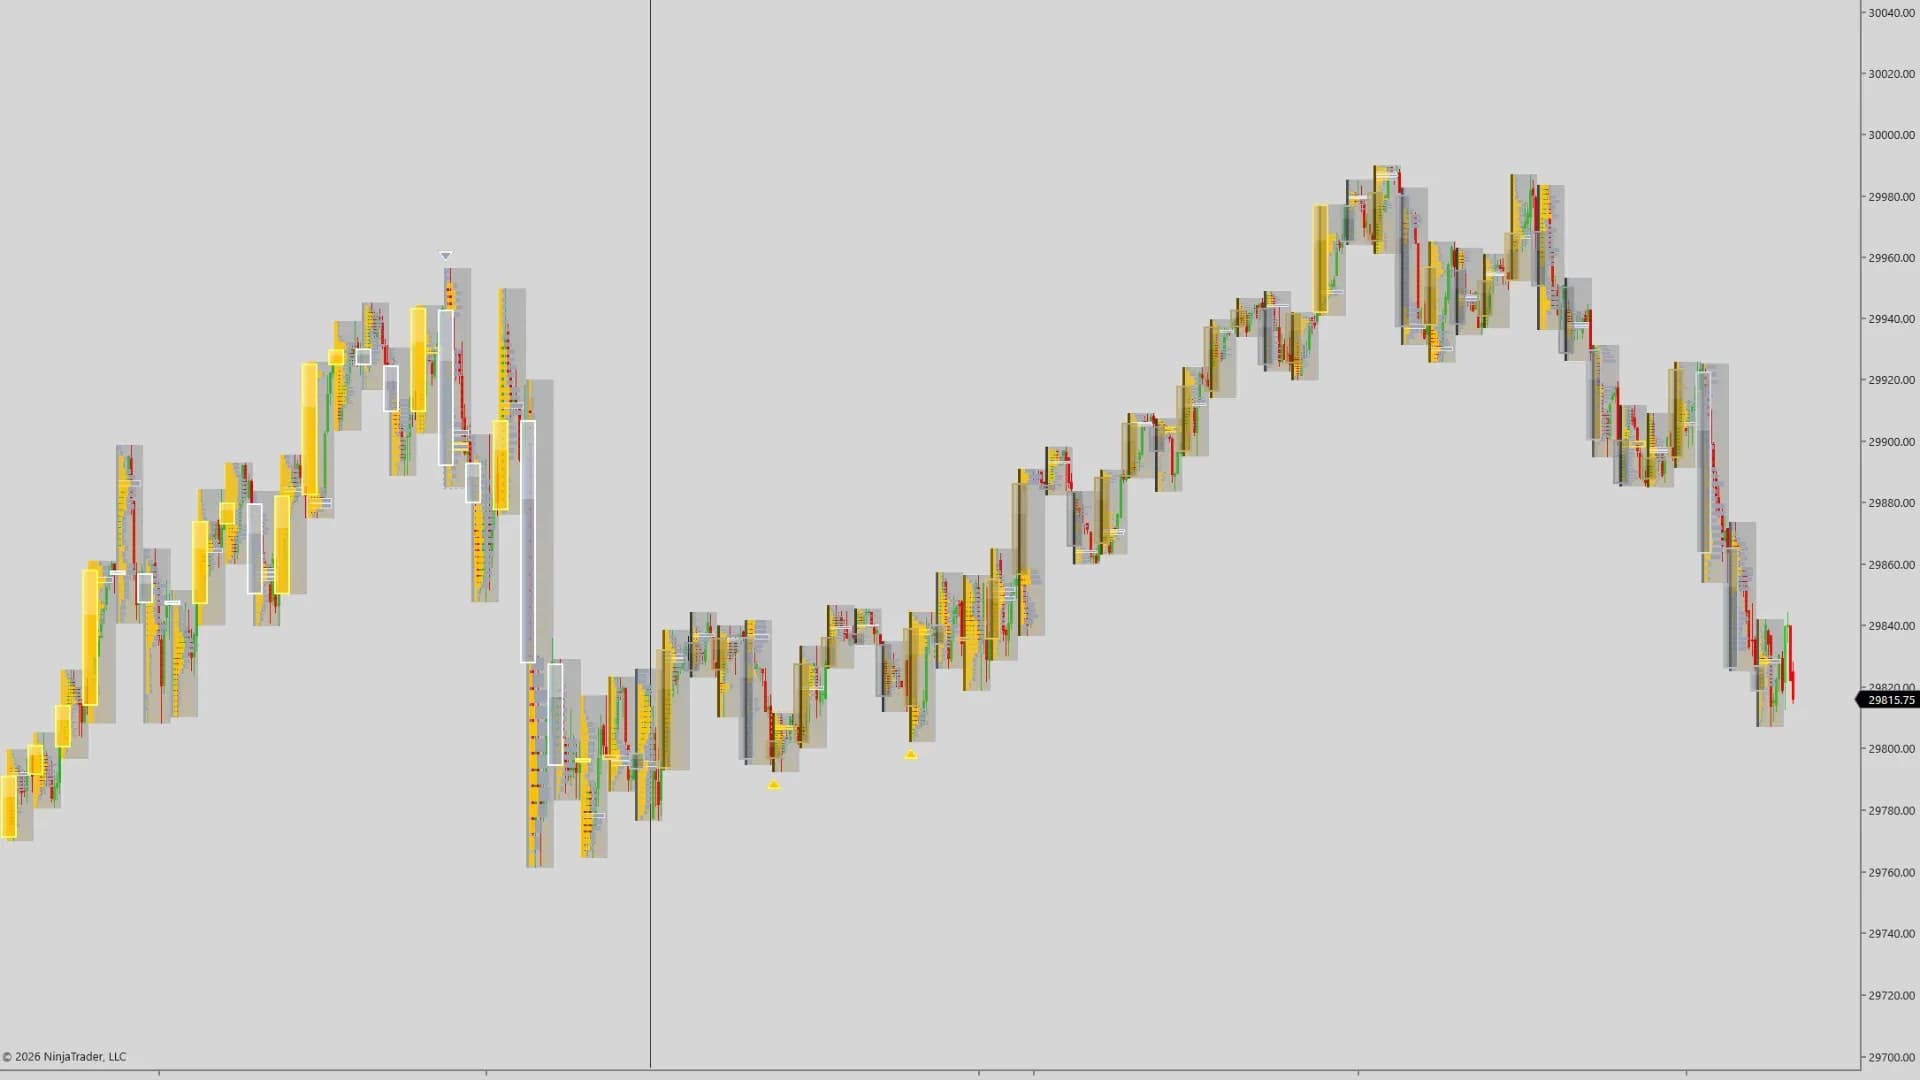
Order flow and volume profile building through the session
How it helps
- Type
- Indicator
- Category
- Order Flow & Volume Profile
- Platform
- NinjaTrader 8
Price tells you where the market went; DS Flow tells you where it traded and who won each level. You get hidden support and resistance from the high-volume nodes, absorption and exhaustion from the buy/sell split, and a silent signal engine that marks reversal candidates with a complete trade plan already attached.
Free
Yours to keep. Not a trial, and it does not expire.
Opening soon. Joining costs nothing and charges nothing — you are told the day it opens.
DS Universe tools are charting and research software for educational and informational purposes. They are not investment advice and no output is a forecast or a guarantee of any result. Trading futures and other leveraged instruments carries substantial risk of loss and is not suitable for every investor.
In detail
Price is where the market went. This is where it did business — and who was pressing.
Each group of candles is x-rayed into a volume-by-price profile: one row per price, split into buy and sell, longest row the fairest price.
What the rows tell you
- HVN shelves — the heavy, accepted levels that pull price back and produce reactions
- FIGHT nodes — extremely heavy and two-sided, rare by design, and usually resolved by a move
- Thin rows — what the market rejected, and slices back through
- A glass candle that dims on weak volume, so a hollow move is obvious
A silent second engine marks reversals only when three things land together: a swept level, a flipped delta, and the point of control accepted at the far end of the range. Session mode groups by Asia, London and New York. Profiles build on closed bars.

Test it on your own charts first.
Four screenshots and a paragraph are not enough to judge an indicator on. Watch it work in your own instrument, on your own timeframe, before it goes anywhere near a live account. Both ways of doing that are free.
- 01
Replay a session you have already seen
Market Replay runs a past session back tick by tick, at whatever speed you like. You get to watch DS Flow print in conditions you remember, and pause on the bars where it mattered.
- 02
Then trade it forward, on the simulator
Replay shows you the past with the ending already known. The simulator does not — it runs live, in real time, on real prices, with nothing at stake. That is where you find out whether you can actually act on what you are seeing.
A simulated fill is not a live fill. Replay and the simulator cannot reproduce real queue position, slippage, or what it feels like to hold a position with money on it, and results from either may differ materially from live trading. Test to learn how a tool behaves — not to estimate what it might return.
More indicators
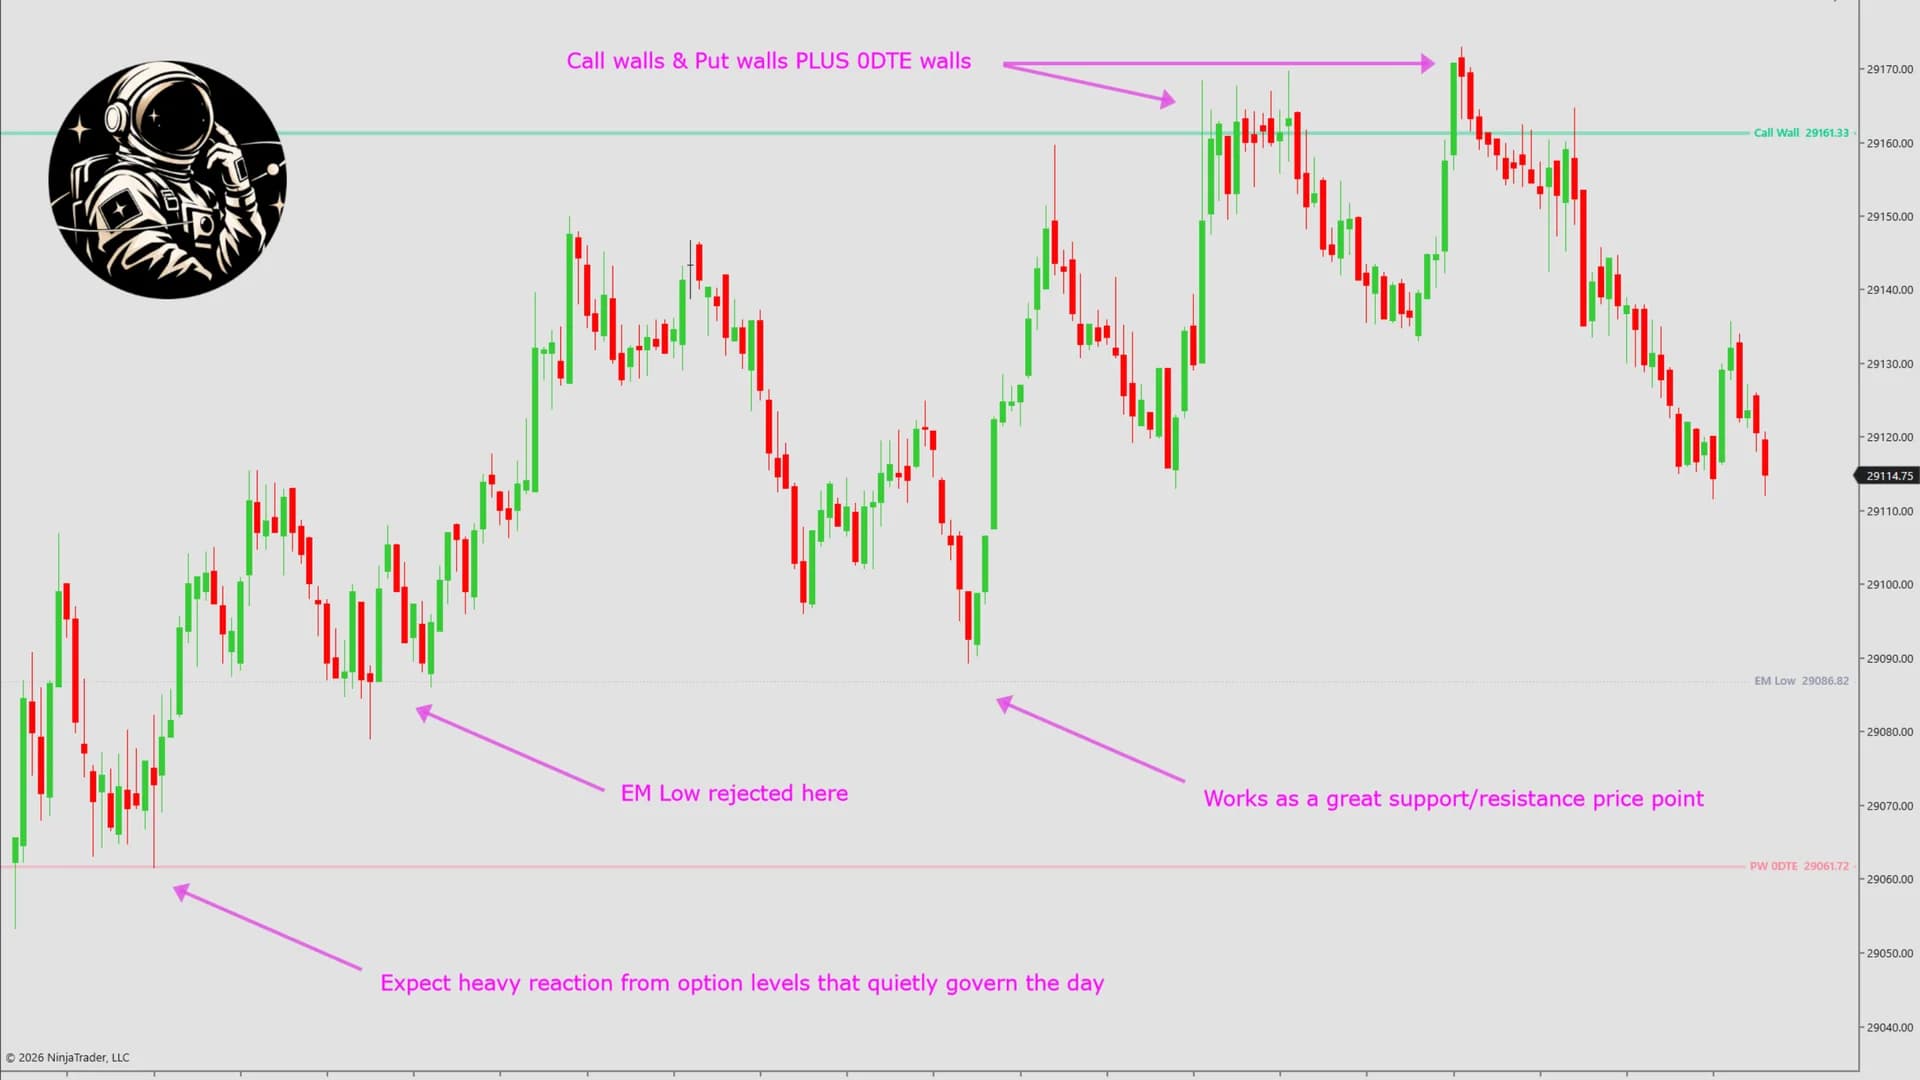
Options & Key Levels
DS GEX
Dealer gamma exposure levels computed straight from the live option chain and plotted as bold horizontal lines – no subscription, no pasting, no setup.
Learn more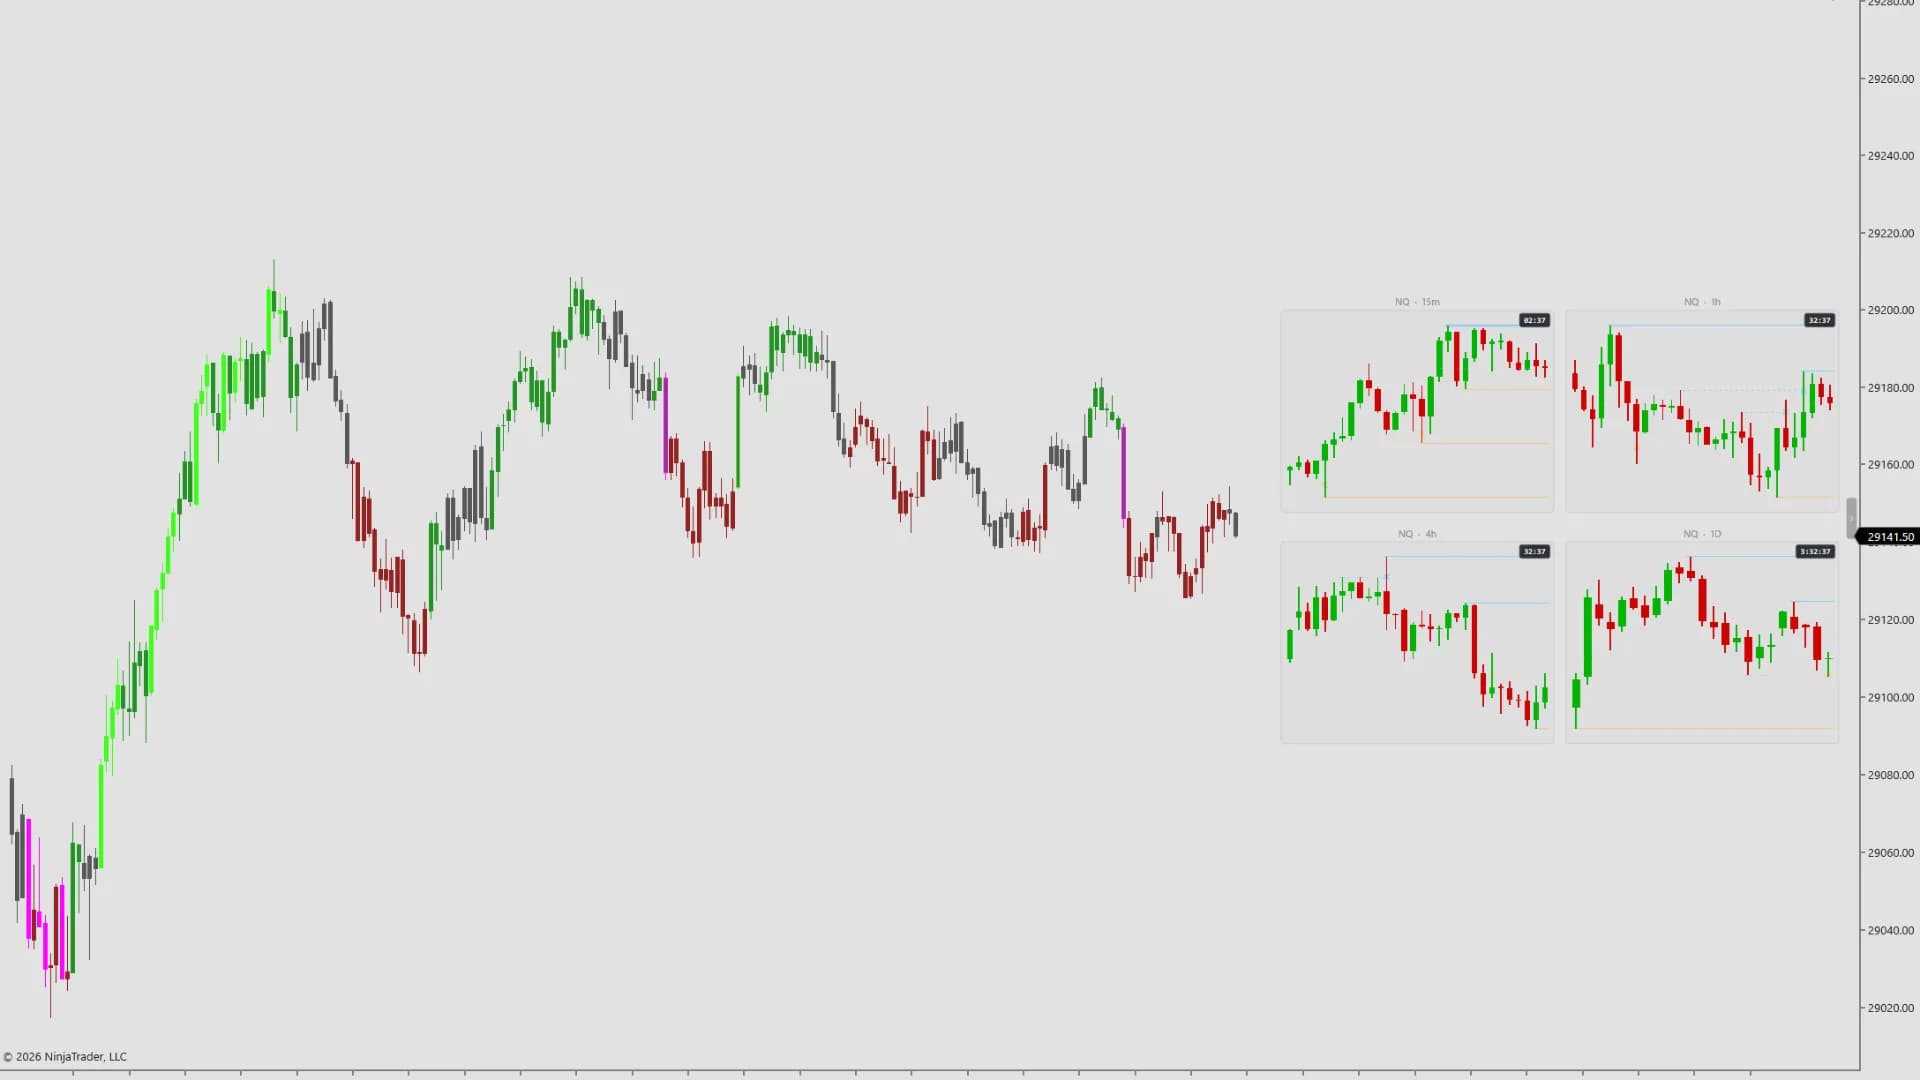
Multi-Timeframe Liquidity
DS Parallax
A multi-timeframe liquidity matrix: four live higher-timeframe charts in the corner of your chart, each marking exactly where the stops are resting.
Learn more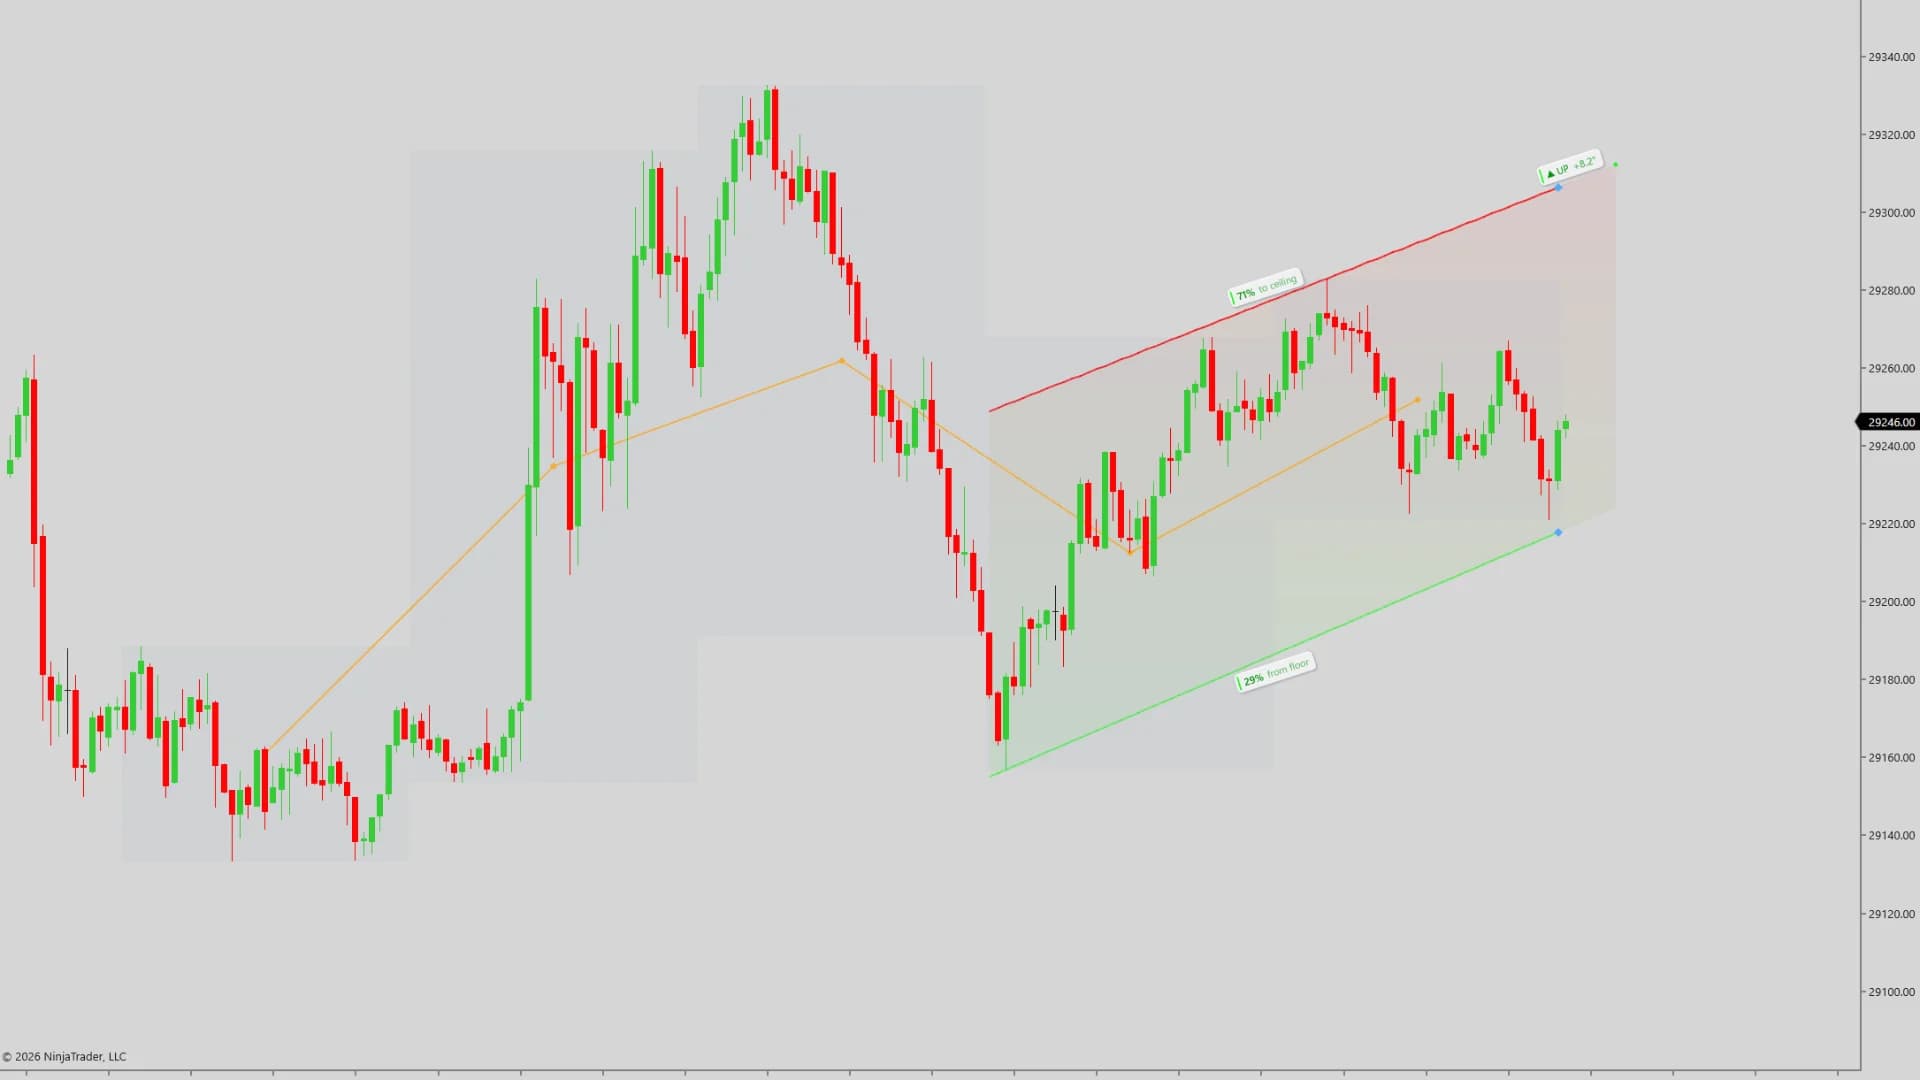
Trend Channels
DS Isotropic Lines
Sigma-normalised structural trend channels – a trend angle that is a property of the market rather than of your monitor.
Learn more