
DS Isotropic Lines
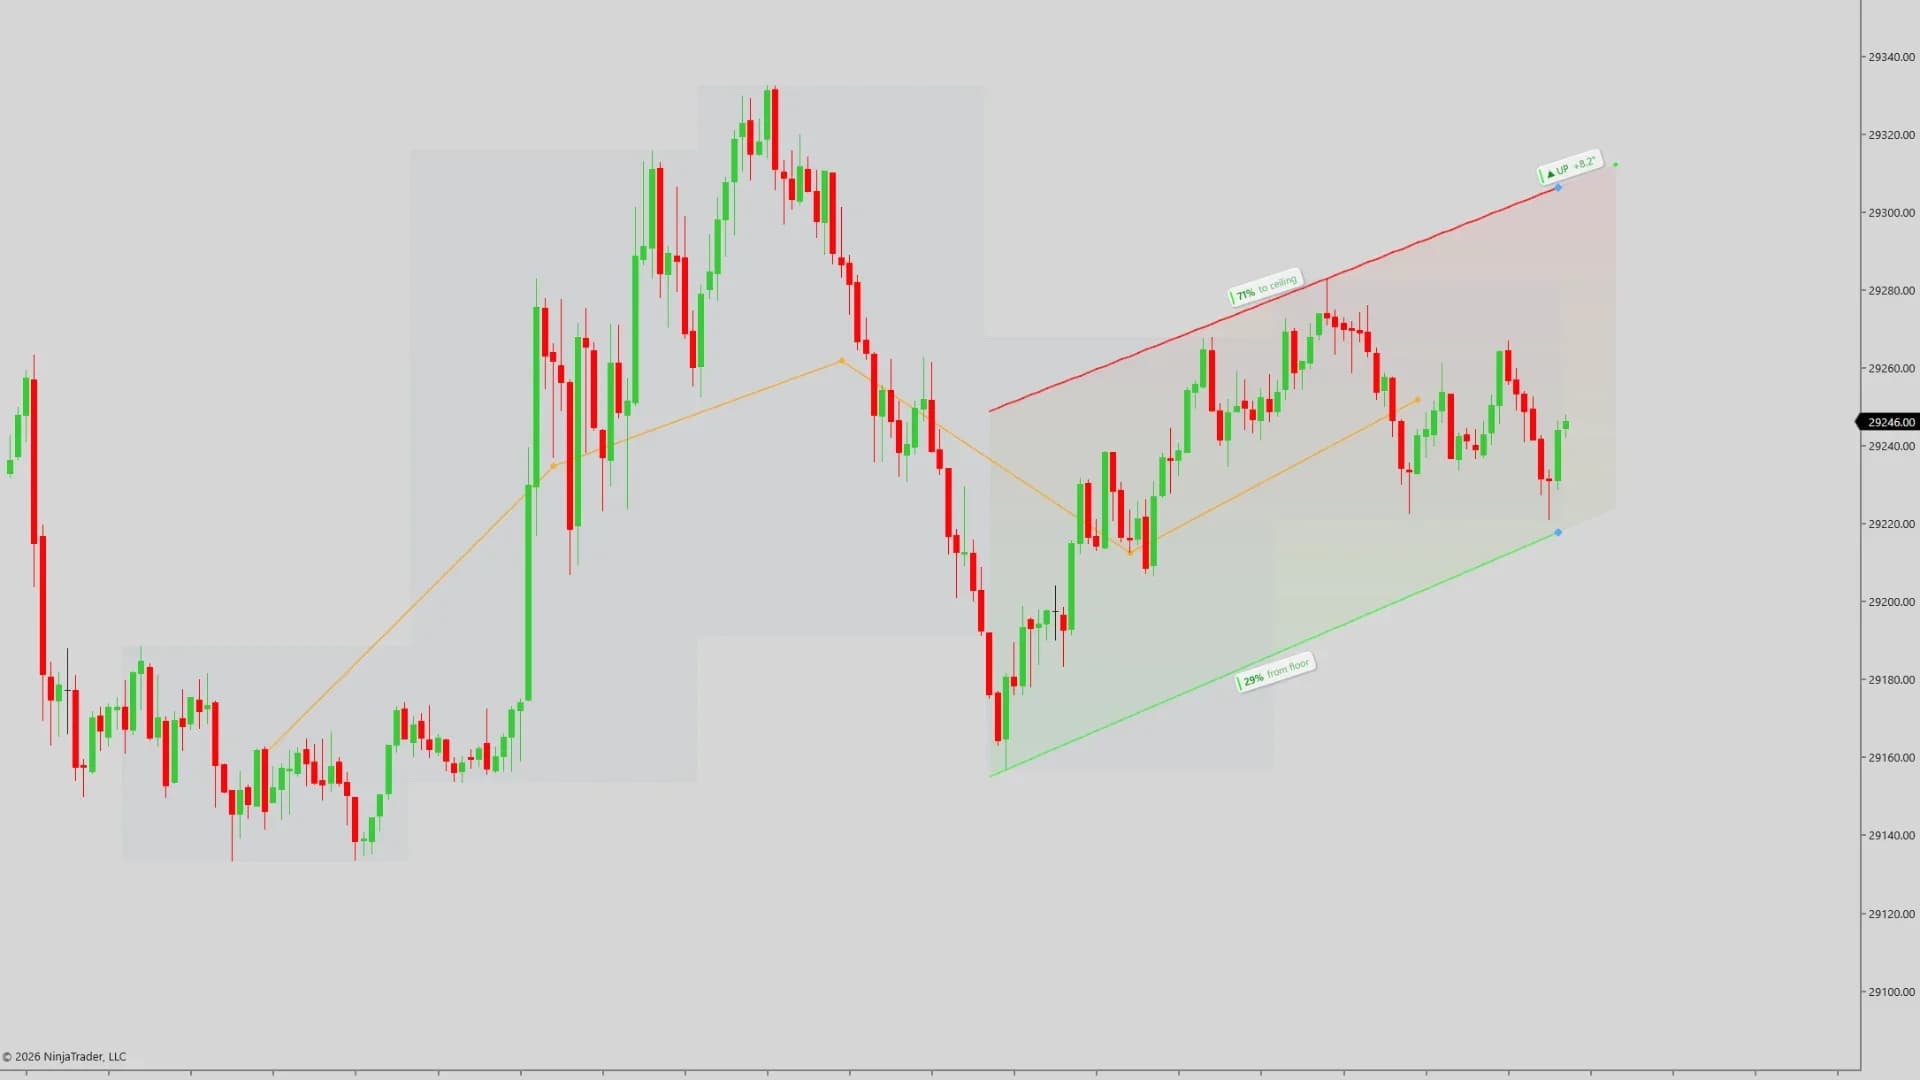
Sigma-normalised structural trend channels – a trend angle that is a property of the market rather than of your monitor.
- 45 degrees means 1 sigma
- Six scales vote
- Sigma-clamped channels
- No repaint
Risk disclosureChart pictures are illustrations of the software, not a performance record. Futures trading carries substantial risk of loss and is not suitable for every investor, and hypothetical or simulated results have inherent limitations that may differ materially from live trading. Read them in full.
How it helps
- Type
- Indicator
- Category
- Trend Channels
- Platform
- NinjaTrader 8
Resize a normal chart and every trend angle changes, which makes the word 'steep' meaningless. DS Isotropic Lines normalises log-price by Yang-Zhang volatility so 45 degrees means roughly one sigma per bar on any instrument and any timeframe, then runs six scales in parallel and tells you how many of them agree.
Free
Yours to keep. Not a trial, and it does not expire.
Opening soon. Joining costs nothing and charges nothing — you are told the day it opens.
DS Universe tools are charting and research software for educational and informational purposes. They are not investment advice and no output is a forecast or a guarantee of any result. Trading futures and other leveraged instruments carries substantial risk of loss and is not suitable for every investor.
In detail
An angle on a chart is a lie your monitor tells you. Resize the window and the slope changes.
DS Isotropic Lines normalises log-price by Yang-Zhang volatility, so an angle becomes a property of the market instead of your screen: 45° is roughly one sigma per bar, on any instrument and any timeframe.
How the channel is built
- Boundaries are a least-squares fit, sigma-clamped so one freak wick cannot define them
- The ceiling can never cross the floor
- In a true range it says so and goes flat, rather than fitting a trend that is not there
- Six scales run in parallel and report how many agree
Five- and six-of-six agreement are the conditions worth an alert, and a breakout-and-retest state machine drives them. Close Bar anchoring: it does not repaint.

Test it on your own charts first.
Four screenshots and a paragraph are not enough to judge an indicator on. Watch it work in your own instrument, on your own timeframe, before it goes anywhere near a live account. Both ways of doing that are free.
- 01
Replay a session you have already seen
Market Replay runs a past session back tick by tick, at whatever speed you like. You get to watch DS Isotropic Lines print in conditions you remember, and pause on the bars where it mattered.
- 02
Then trade it forward, on the simulator
Replay shows you the past with the ending already known. The simulator does not — it runs live, in real time, on real prices, with nothing at stake. That is where you find out whether you can actually act on what you are seeing.
A simulated fill is not a live fill. Replay and the simulator cannot reproduce real queue position, slippage, or what it feels like to hold a position with money on it, and results from either may differ materially from live trading. Test to learn how a tool behaves — not to estimate what it might return.
More indicators
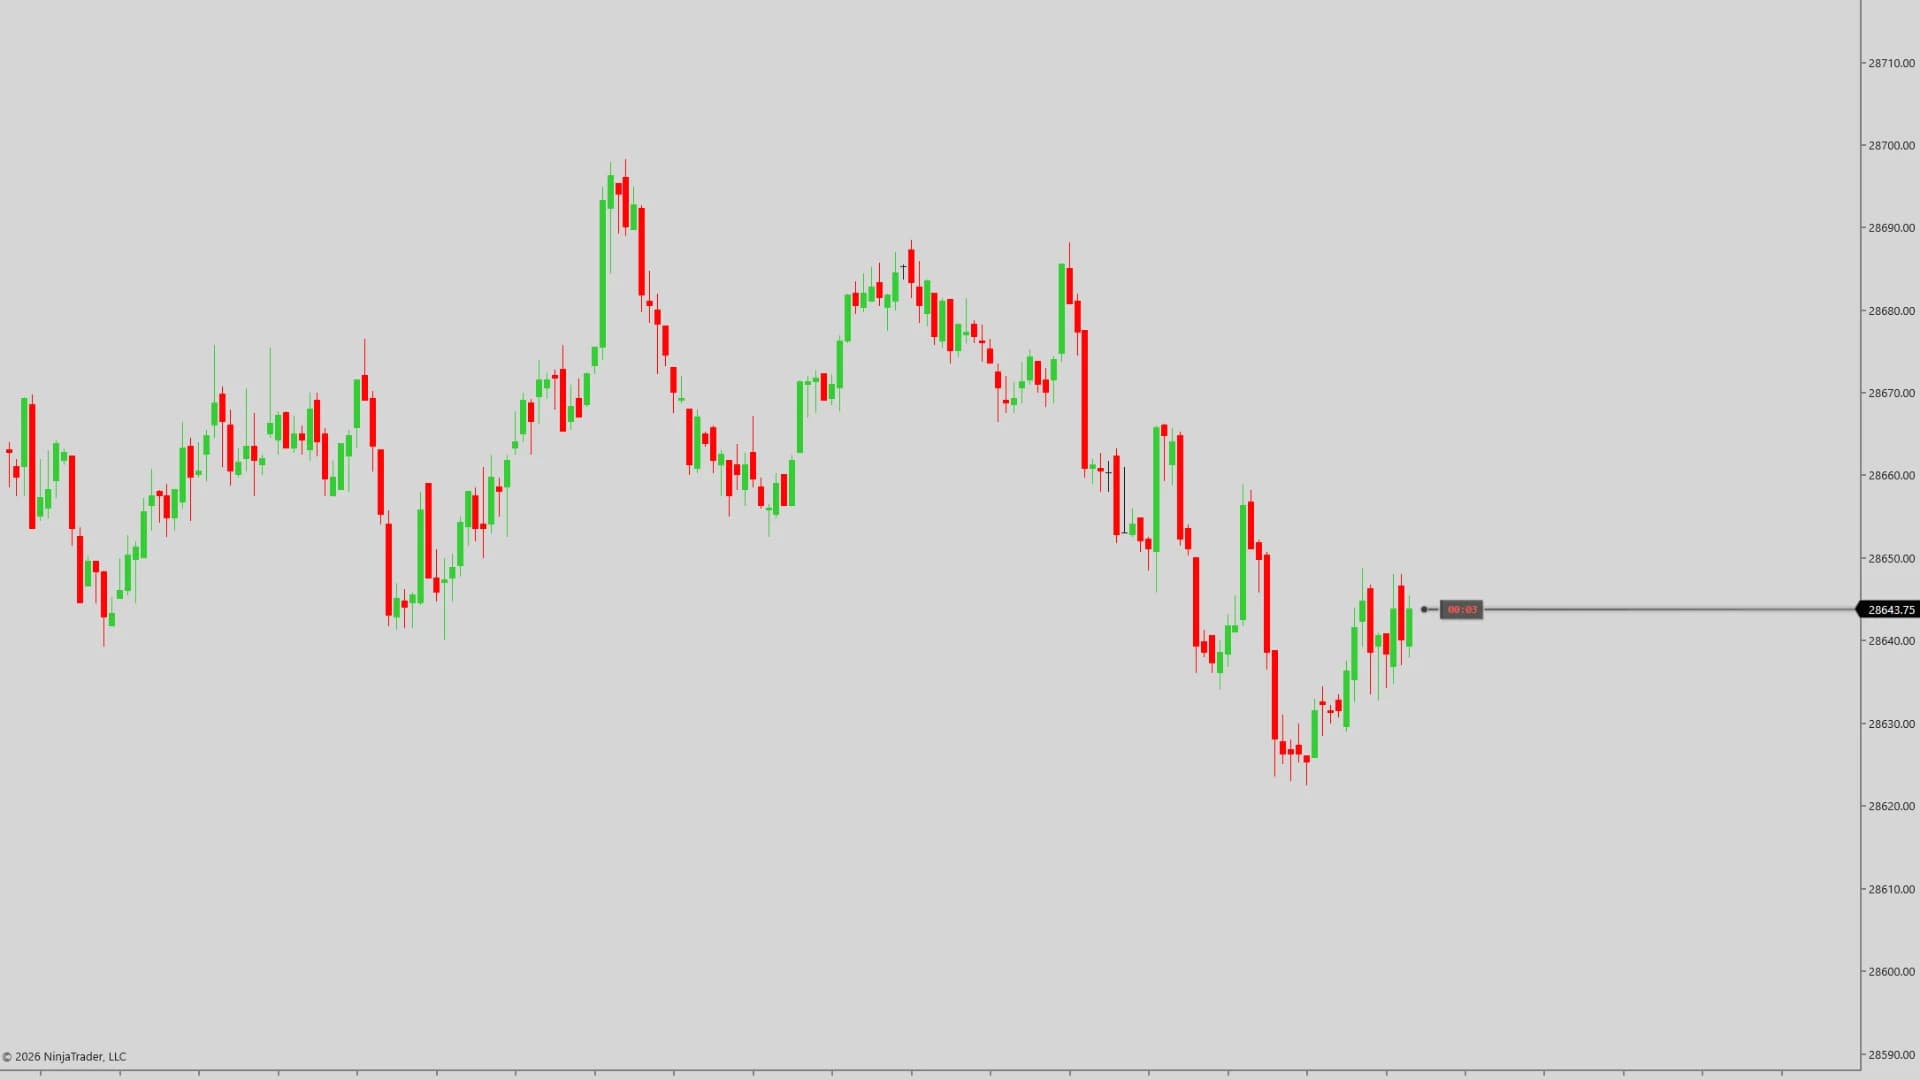
Chart Essentials
DS Adaptive PriceLine
A self-anchoring replacement for NinjaTrader's native price line that re-derives its geometry every frame, from the live candle to the price axis.
Learn more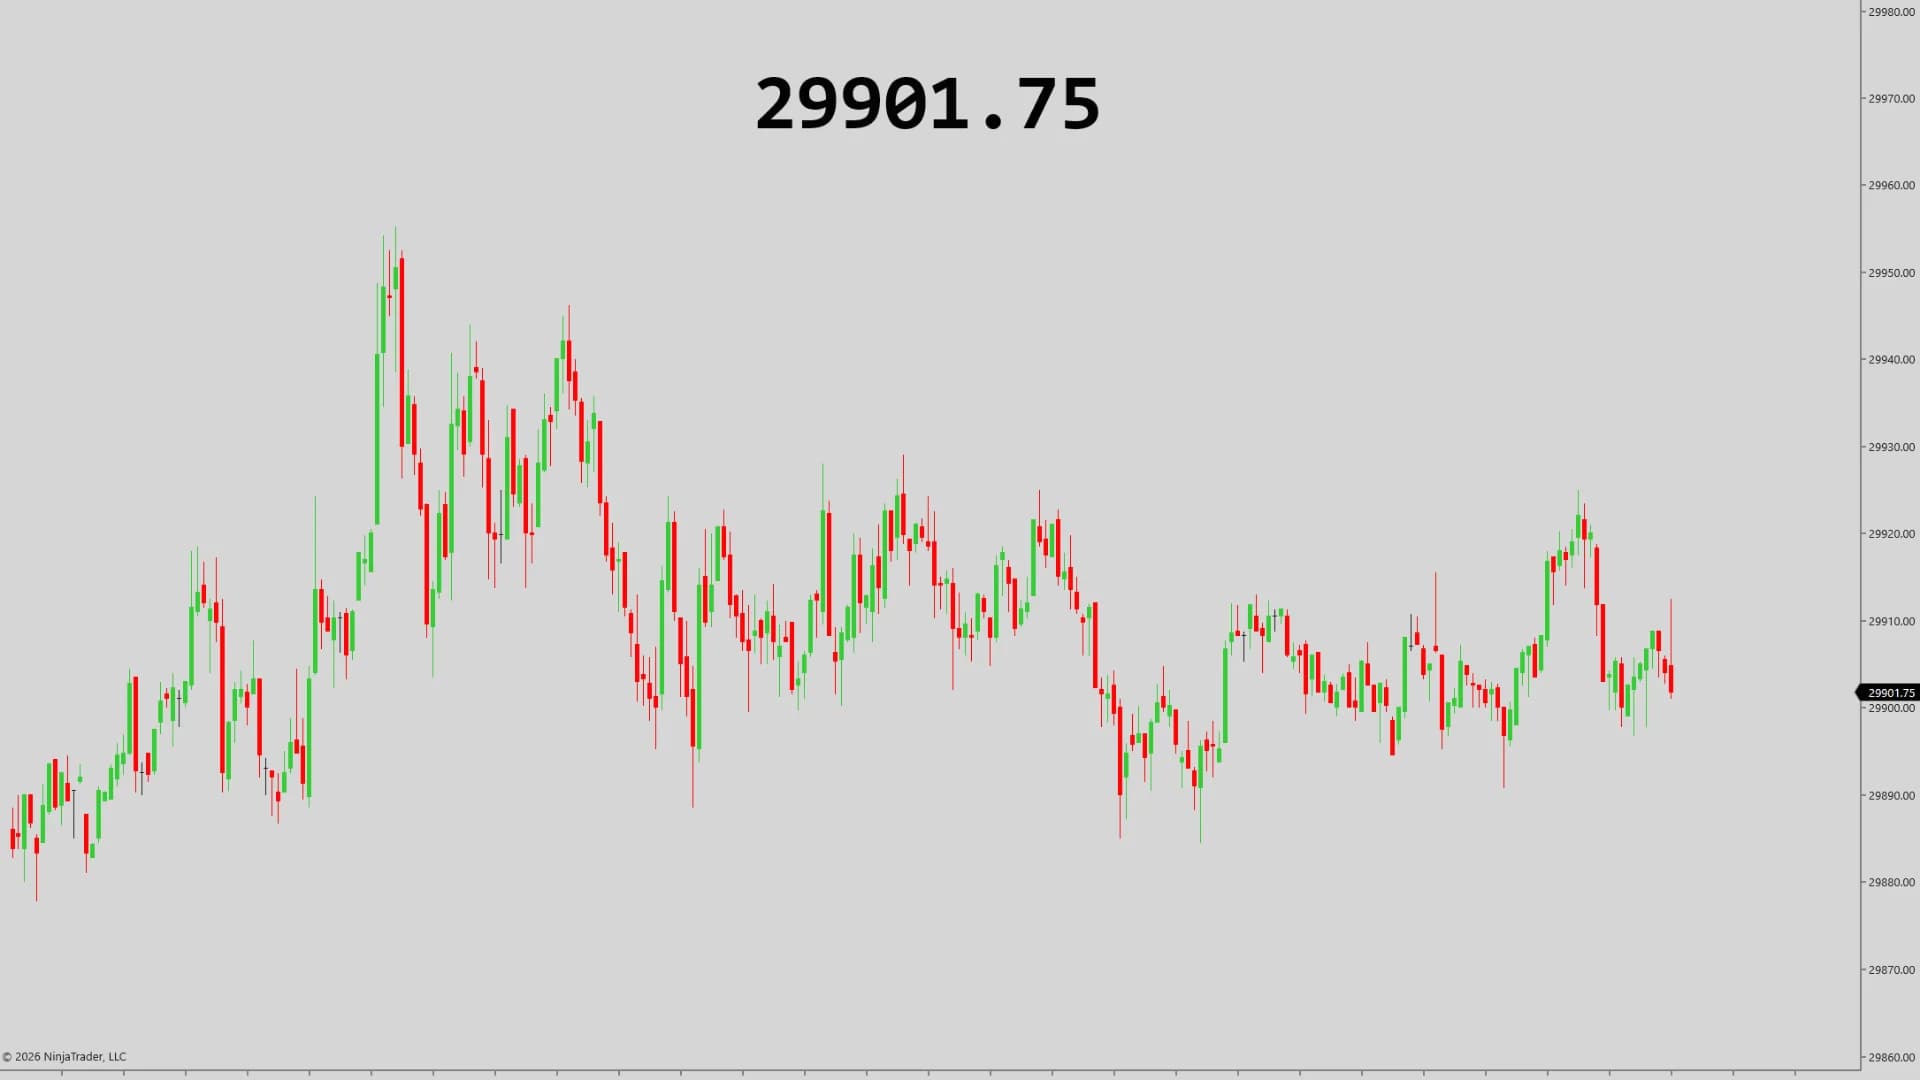
Chart Essentials
DS Chart Price
A large animated last-price readout that blinks green on upticks and red on downticks, turns amber when the tape goes choppy, and carries a three-level alert engine.
Learn more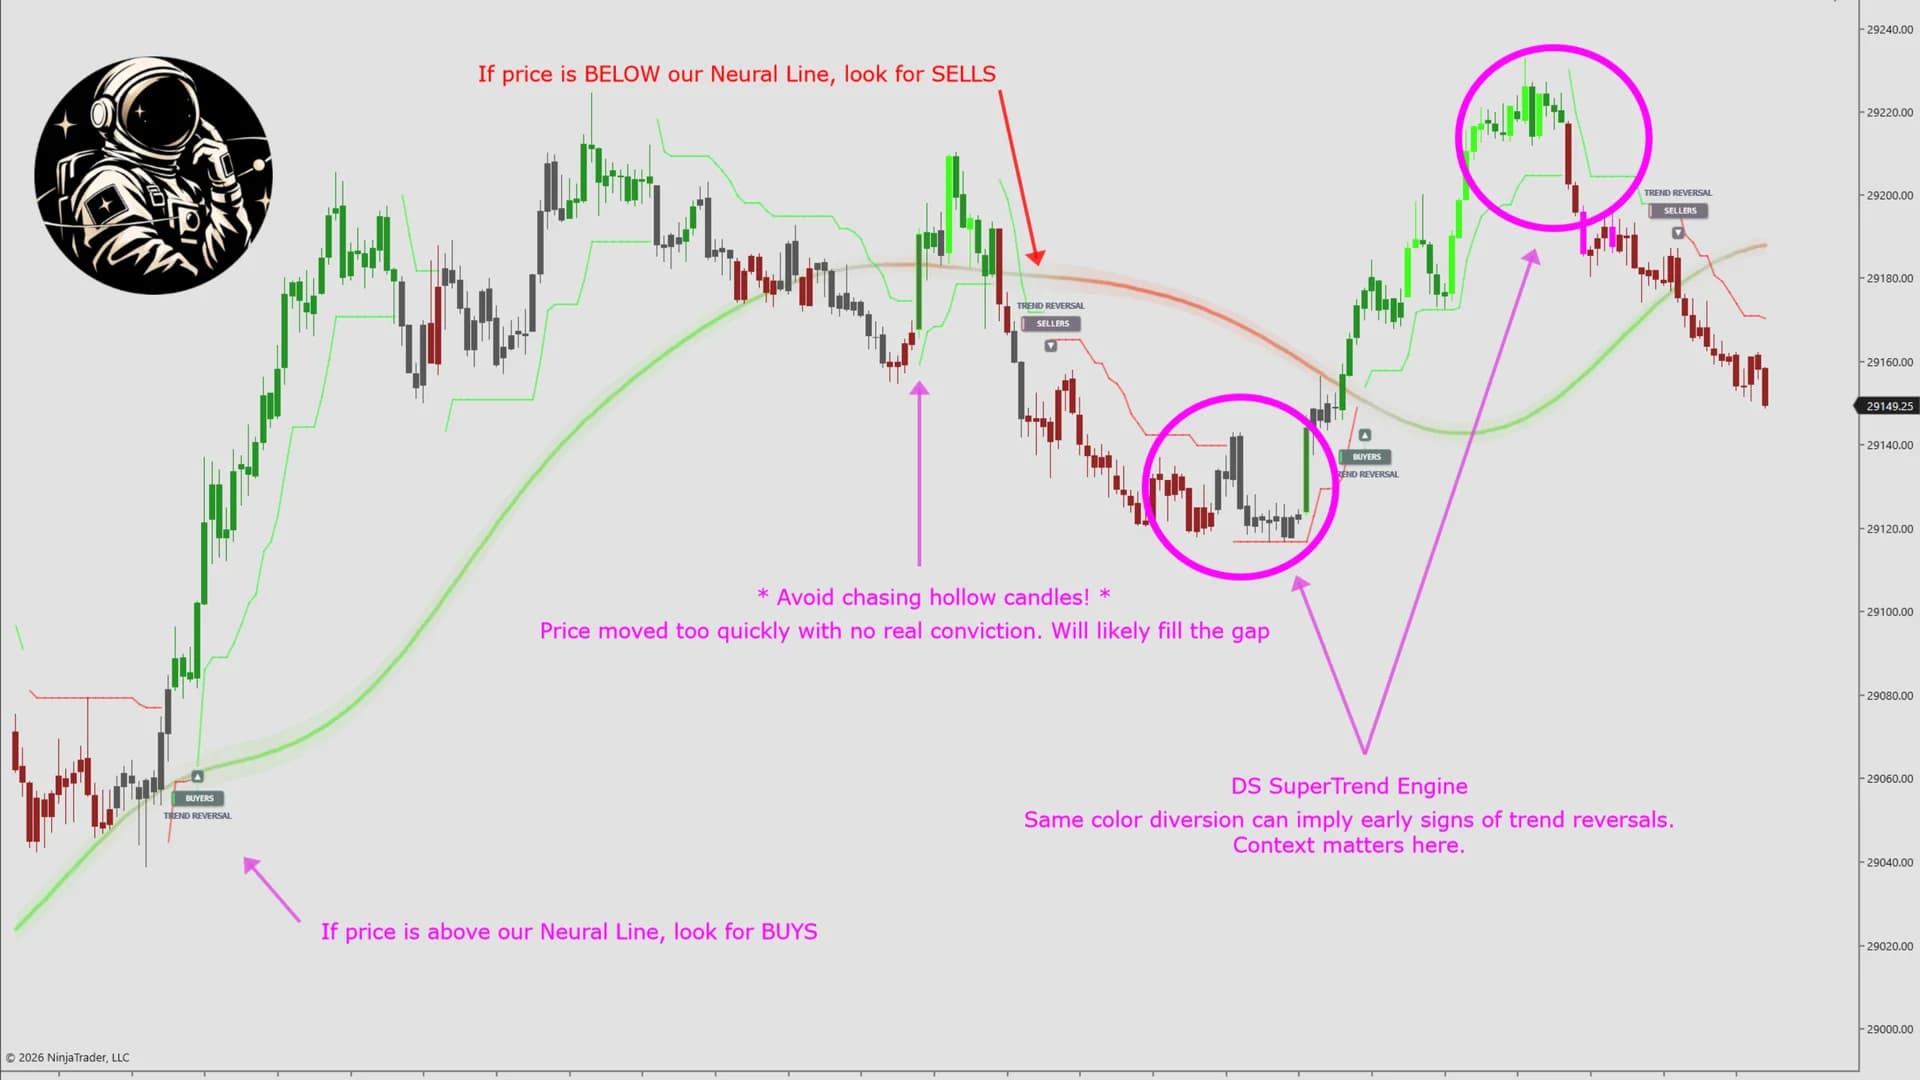
AI Trend & Signals
DS Oracle
A machine-learning-confirmed trend engine – every SuperTrend flip validated by AI, with a Neural Line setting which side you are allowed to trade.
Learn more