DS ProRSI
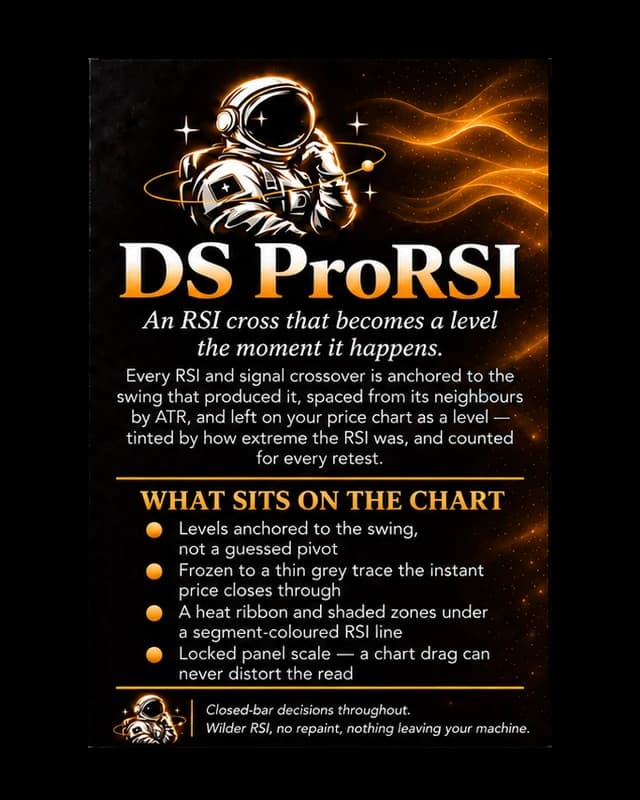
An RSI panel that turns every crossover into a support or resistance level on your price chart — anchored to the swing that produced it, ATR-spaced, and frozen the moment price closes through.
- Levels anchored to the actual swing
- Frozen the instant price closes through
- Heat-tinted by how extreme the RSI was
- Locked panel scale, never drifts
Risk disclosureChart pictures are illustrations of the software, not a performance record. Futures trading carries substantial risk of loss and is not suitable for every investor, and hypothetical or simulated results have inherent limitations that may differ materially from live trading. Read them in full.
Momentum meets price.
- Type
- Indicator
- Series
- Pro Series panels
- Category
- Momentum & Auto-Levels
- Platform
- NinjaTrader 8
How it helps
An RSI reading tells you overbought or oversold and nothing about where price actually turns. DS ProRSI takes every RSI/signal crossover, anchors it to the swing that produced it, and leaves it on your price chart as a level — tinted by how extreme the RSI was, counted for every retest, and frozen the moment price actually closes through it. You get support and resistance built from momentum, not from a pivot script guessing at swing points.
One payment · yours to keep · updates included
Nothing is charged and no card is asked for — you are told the day it opens.
Or take everything — DS Complete, every DS Universe product in one license, for $374.95.
DS Universe tools are charting and research software for educational and informational purposes. They are not investment advice and no output is a forecast or a guarantee of any result. Trading futures and other leveraged instruments carries substantial risk of loss and is not suitable for every investor.
In detail
An RSI cross is a moment on an oscillator. This turns it into a level on your actual chart.
Every RSI/signal crossover is anchored to the swing that produced it, spaced from its neighbours by ATR, and left on the price panel as a level you can actually trade against.
How a level behaves
- Tinted by how extreme the RSI was the moment it was born
- Labelled with the exact RSI reading and a live touch count
- Frozen to a thin grey trace the instant price closes through it
- The panel's Y-axis locks, so dragging the chart can never distort the read
Underneath, a full RSI panel: heat ribbon, shaded 30/70 zones, a segment-coloured line, and the nearest support and resistance distance in points and percent.
Closed-bar decisions throughout — it does not repaint.

Test it on your own charts first.
Four screenshots and a paragraph are not enough to judge an indicator on. Watch it work in your own instrument, on your own timeframe, before it goes anywhere near a live account. Both ways of doing that are free.
- 01
Replay a session you have already seen
Market Replay runs a past session back tick by tick, at whatever speed you like. You get to watch DS ProRSI print in conditions you remember, and pause on the bars where it mattered.
- 02
Then trade it forward, on the simulator
Replay shows you the past with the ending already known. The simulator does not — it runs live, in real time, on real prices, with nothing at stake. That is where you find out whether you can actually act on what you are seeing.
A simulated fill is not a live fill. Replay and the simulator cannot reproduce real queue position, slippage, or what it feels like to hold a position with money on it, and results from either may differ materially from live trading. Test to learn how a tool behaves — not to estimate what it might return.
From the same series