
DS Toolkit
One translucent rail on your chart: every DS indicator as an on/off row, your drawing tools underneath, and freehand chalk at the bottom.
- One rail, whole chart
- ALL OFF, then exactly back
- Chalk that pans and zooms
- Every drawing tool, one click
Risk disclosureChart pictures are illustrations of the software, not a performance record. Futures trading carries substantial risk of loss and is not suitable for every investor, and hypothetical or simulated results have inherent limitations that may differ materially from live trading. Read them in full.
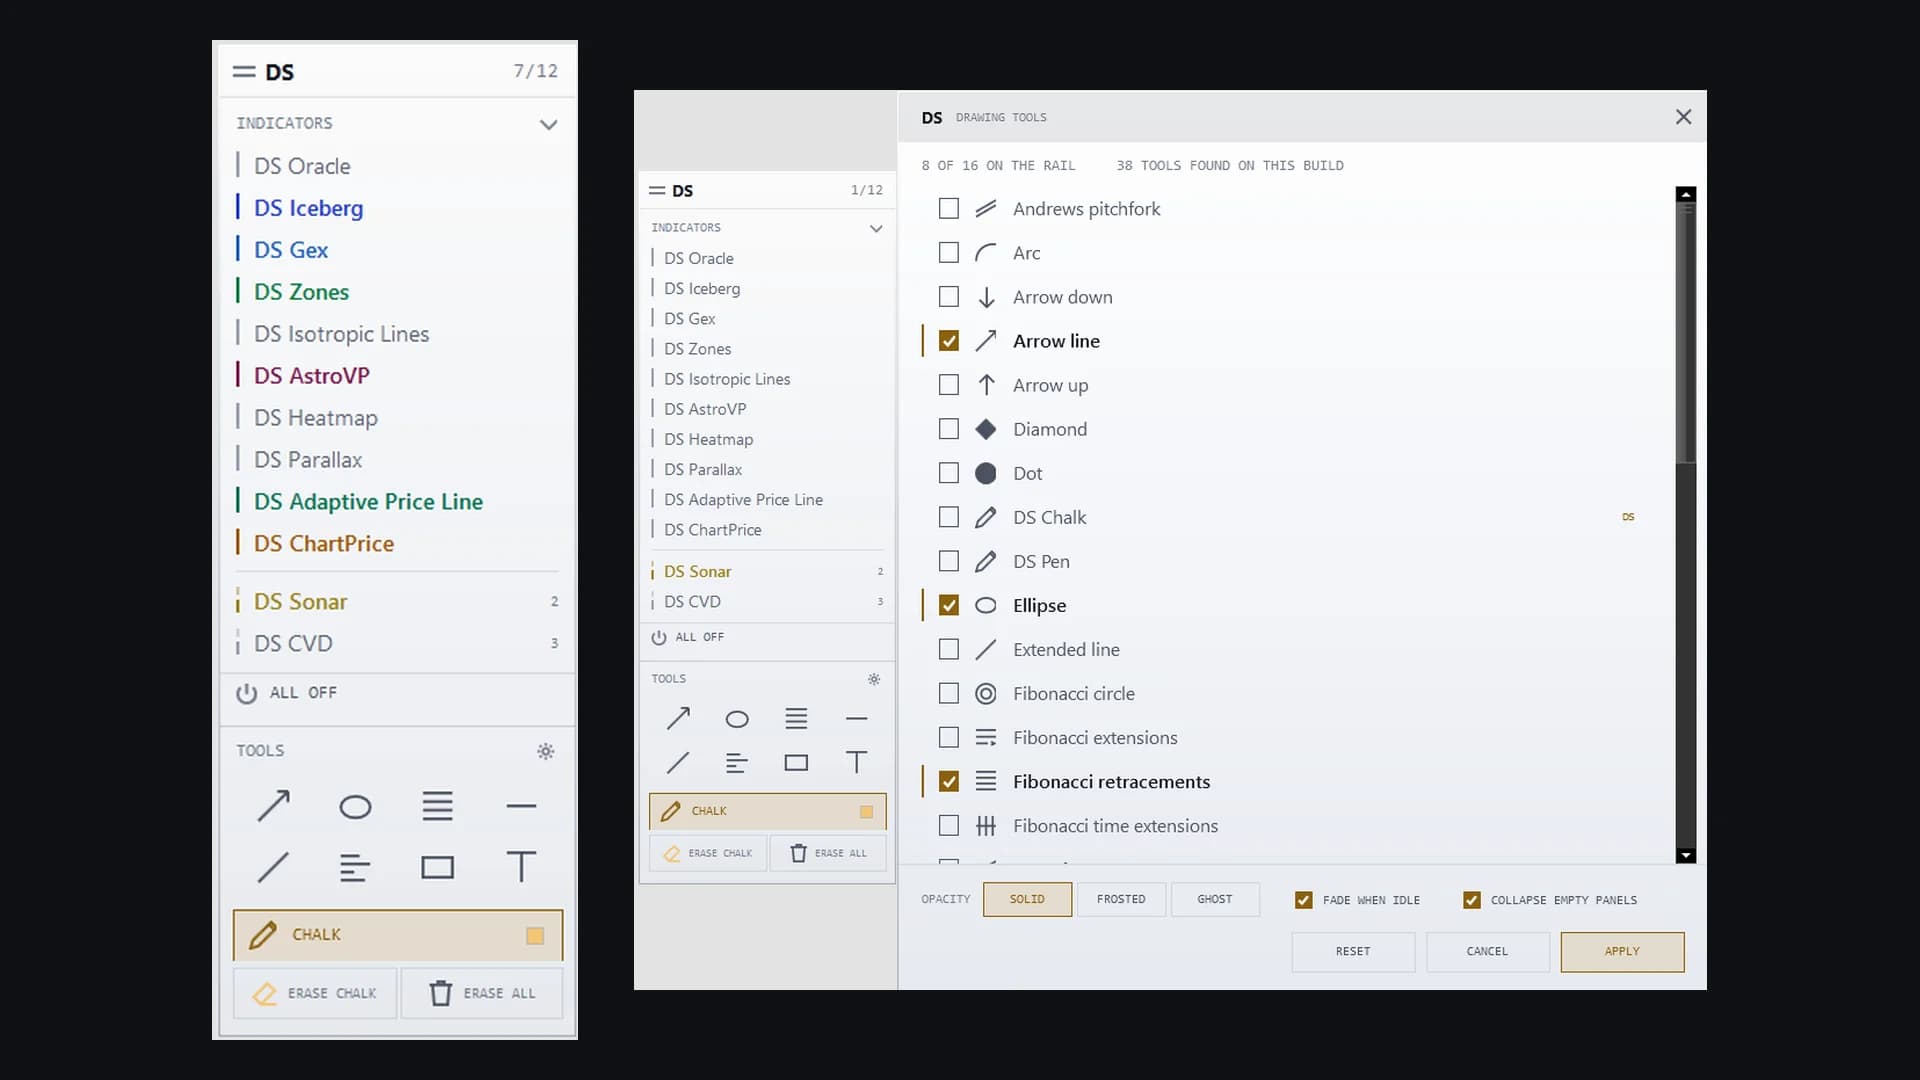
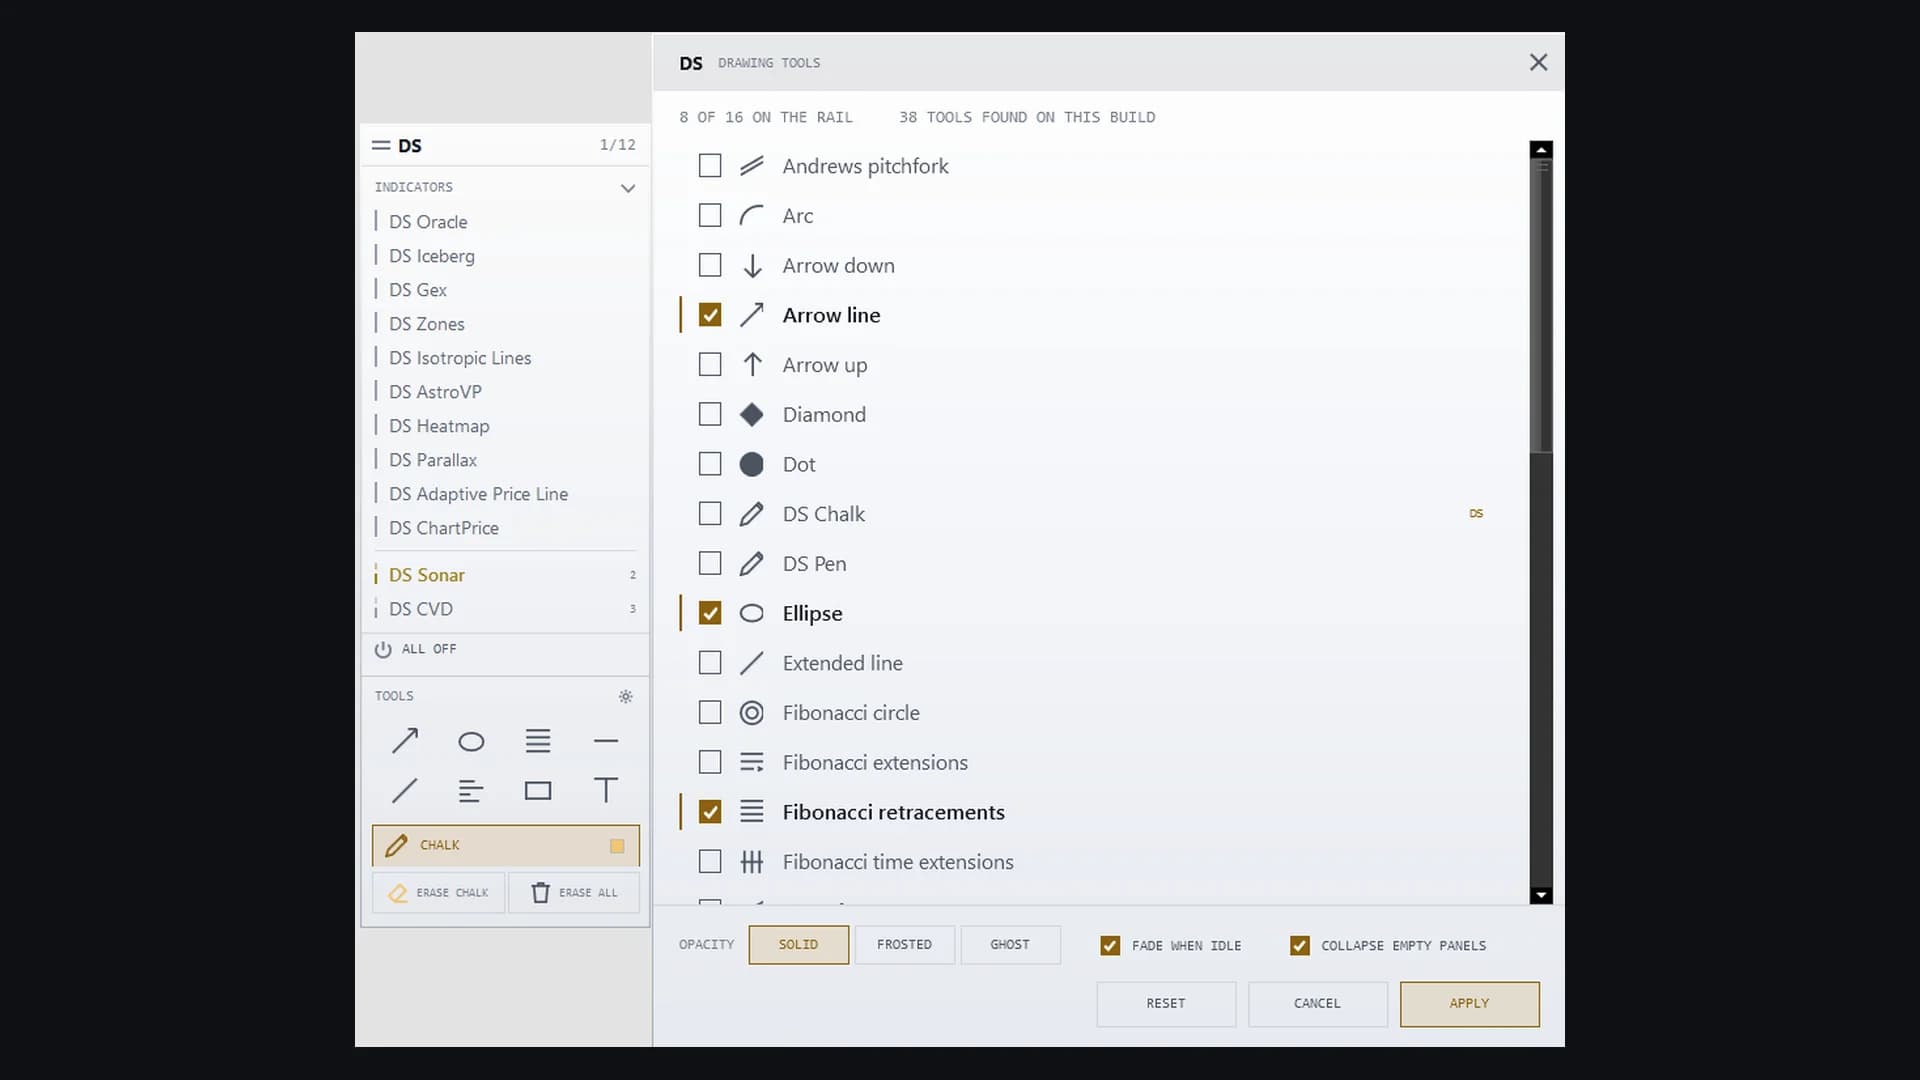
The dock and the drawing-tool picker, side by side
How it helps
- Type
- Add-on
- Category
- Workflow & Control
- Platform
- NinjaTrader 8
It removes the two things that break your rhythm mid-session: hunting through Properties to turn an indicator off, and hunting the toolbar for the right drawing tool. One click per indicator, one click per tool, and a chalk pen for marking up a chart while you think – all from a rail that fades out of the way when you are not using it.
In the bundle
DS Toolkit is not sold on its own — it comes with the indicators bundle. See what that costs.
Opening soon. Joining costs nothing and charges nothing — you are told the day it opens.
DS Universe tools are charting and research software for educational and informational purposes. They are not investment advice and no output is a forecast or a guarantee of any result. Trading futures and other leveraged instruments carries substantial risk of loss and is not suitable for every investor.
In detail
One rail on the chart: your indicators on top, your drawing tools below, chalk at the bottom.
Turning an indicator off usually means Properties, a checkbox and Apply. Here it is one click.
What the rail does
- Lists only the DS indicators actually on that chart, never a menu of things you do not own
- Each switch is a mute, not a preset — your settings and templates survive every toggle
- ALL OFF strips the chart to bare candles; the next click restores exactly what was on
- Sixteen drawing tools, read live from your build, so third-party tools appear for free
DS Chalk is included — a real drawing tool, so every stroke is a time-and-price anchor that pans, zooms and saves with the workspace. Replaces DS Control Panel and DS ToolBar & Checklist. Remove those first.

Test it on your own charts first.
Four screenshots and a paragraph are not enough to judge an indicator on. Watch it work in your own instrument, on your own timeframe, before it goes anywhere near a live account. Both ways of doing that are free.
- 01
Replay a session you have already seen
Market Replay runs a past session back tick by tick, at whatever speed you like. You get to watch DS Toolkit print in conditions you remember, and pause on the bars where it mattered.
- 02
Then trade it forward, on the simulator
Replay shows you the past with the ending already known. The simulator does not — it runs live, in real time, on real prices, with nothing at stake. That is where you find out whether you can actually act on what you are seeing.
A simulated fill is not a live fill. Replay and the simulator cannot reproduce real queue position, slippage, or what it feels like to hold a position with money on it, and results from either may differ materially from live trading. Test to learn how a tool behaves — not to estimate what it might return.
More add-ons
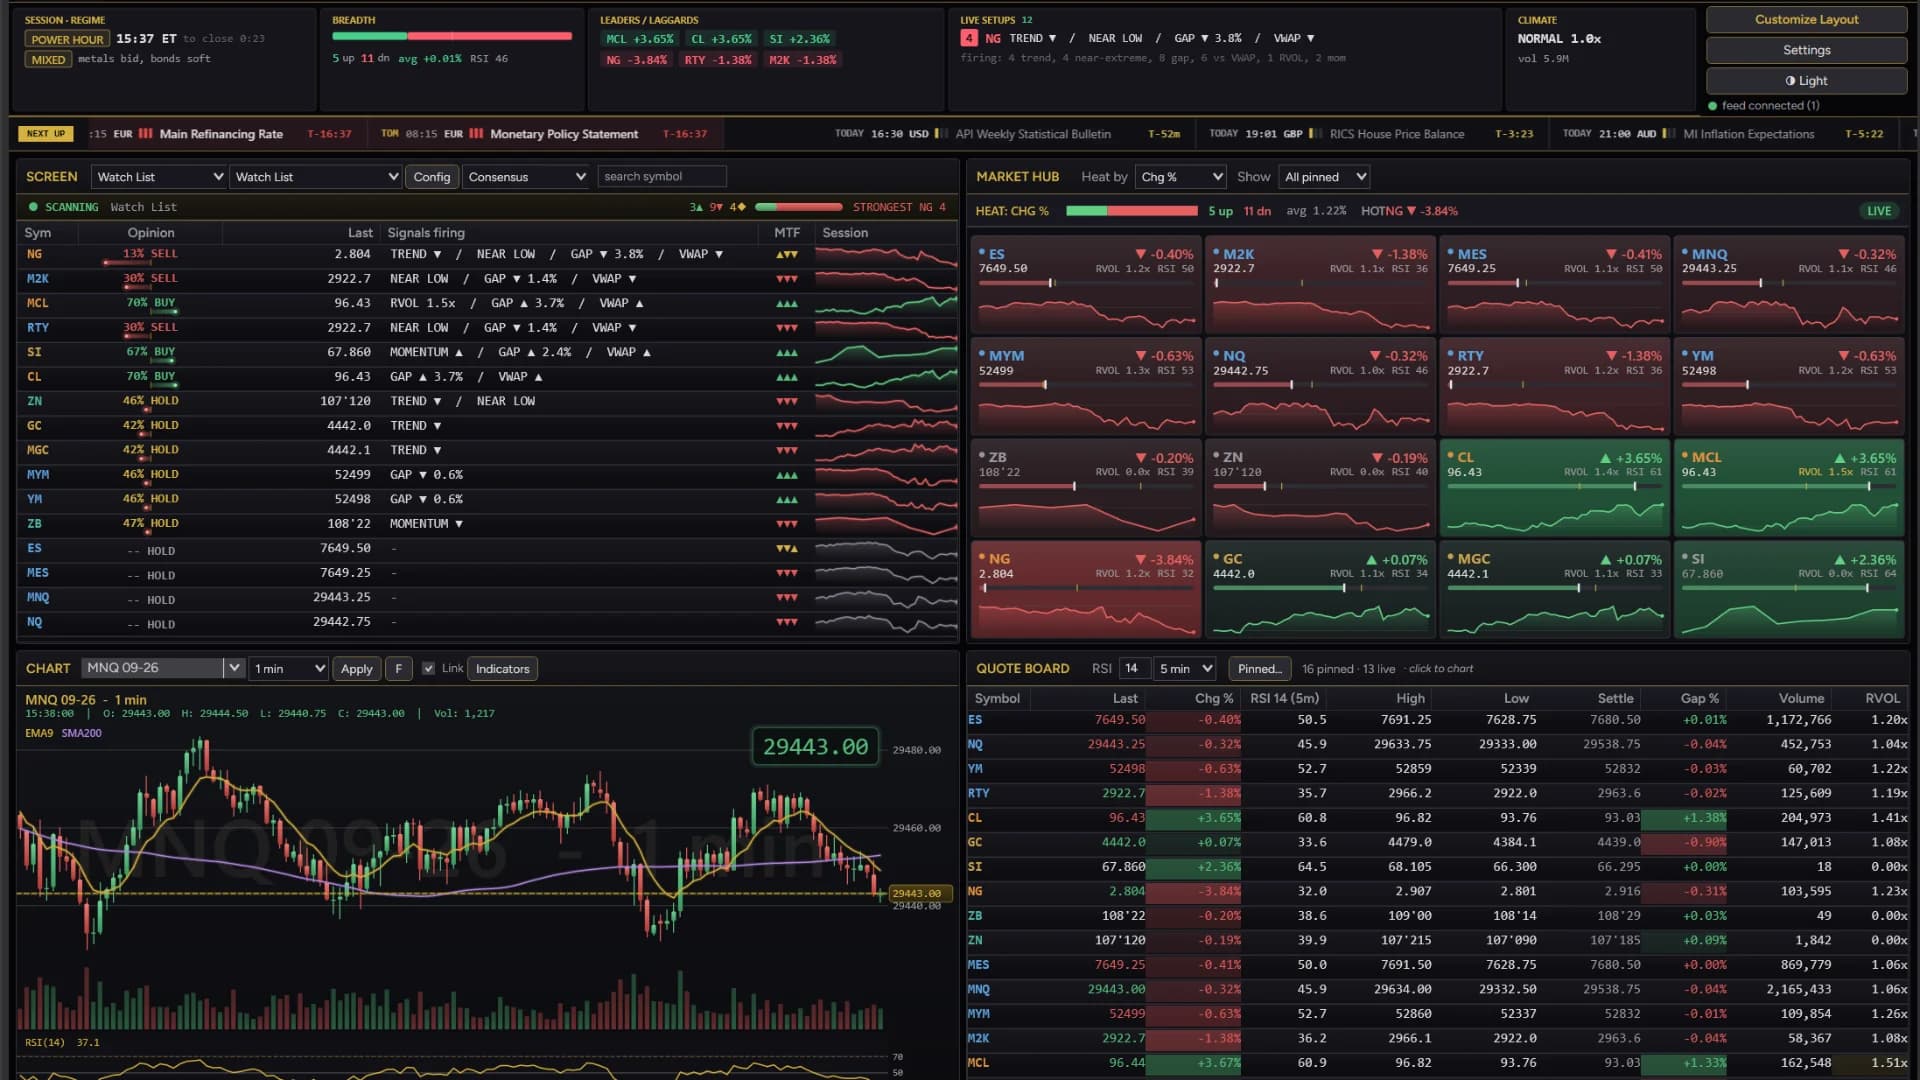
Screening & Dashboard
DS Screener
A real-time market screening dashboard – futures, stocks, options and forex – that you arrange like a trading hub.
Learn more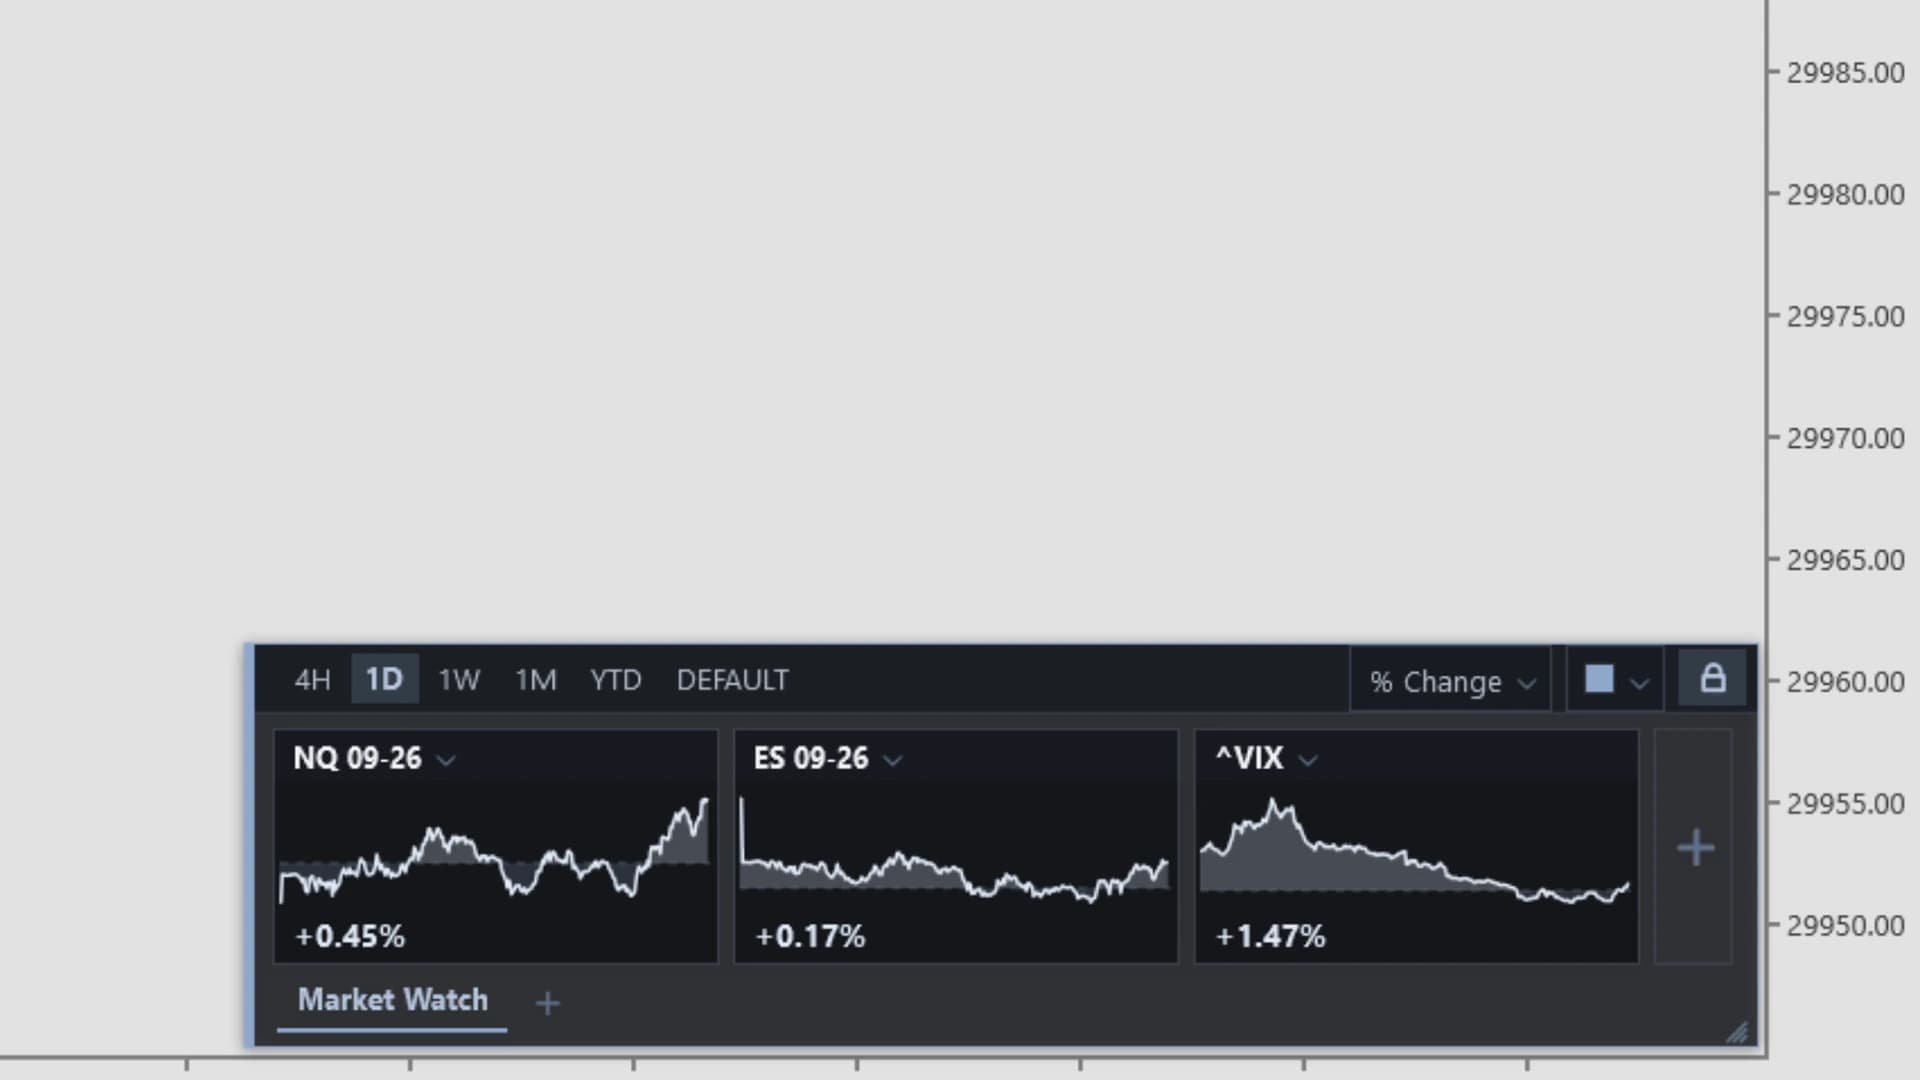
Screening & Dashboard
DS MarketWatch
A floating, draggable market-watch panel of live mini charts on every chart – the on-chart alternative to a second window.
Learn more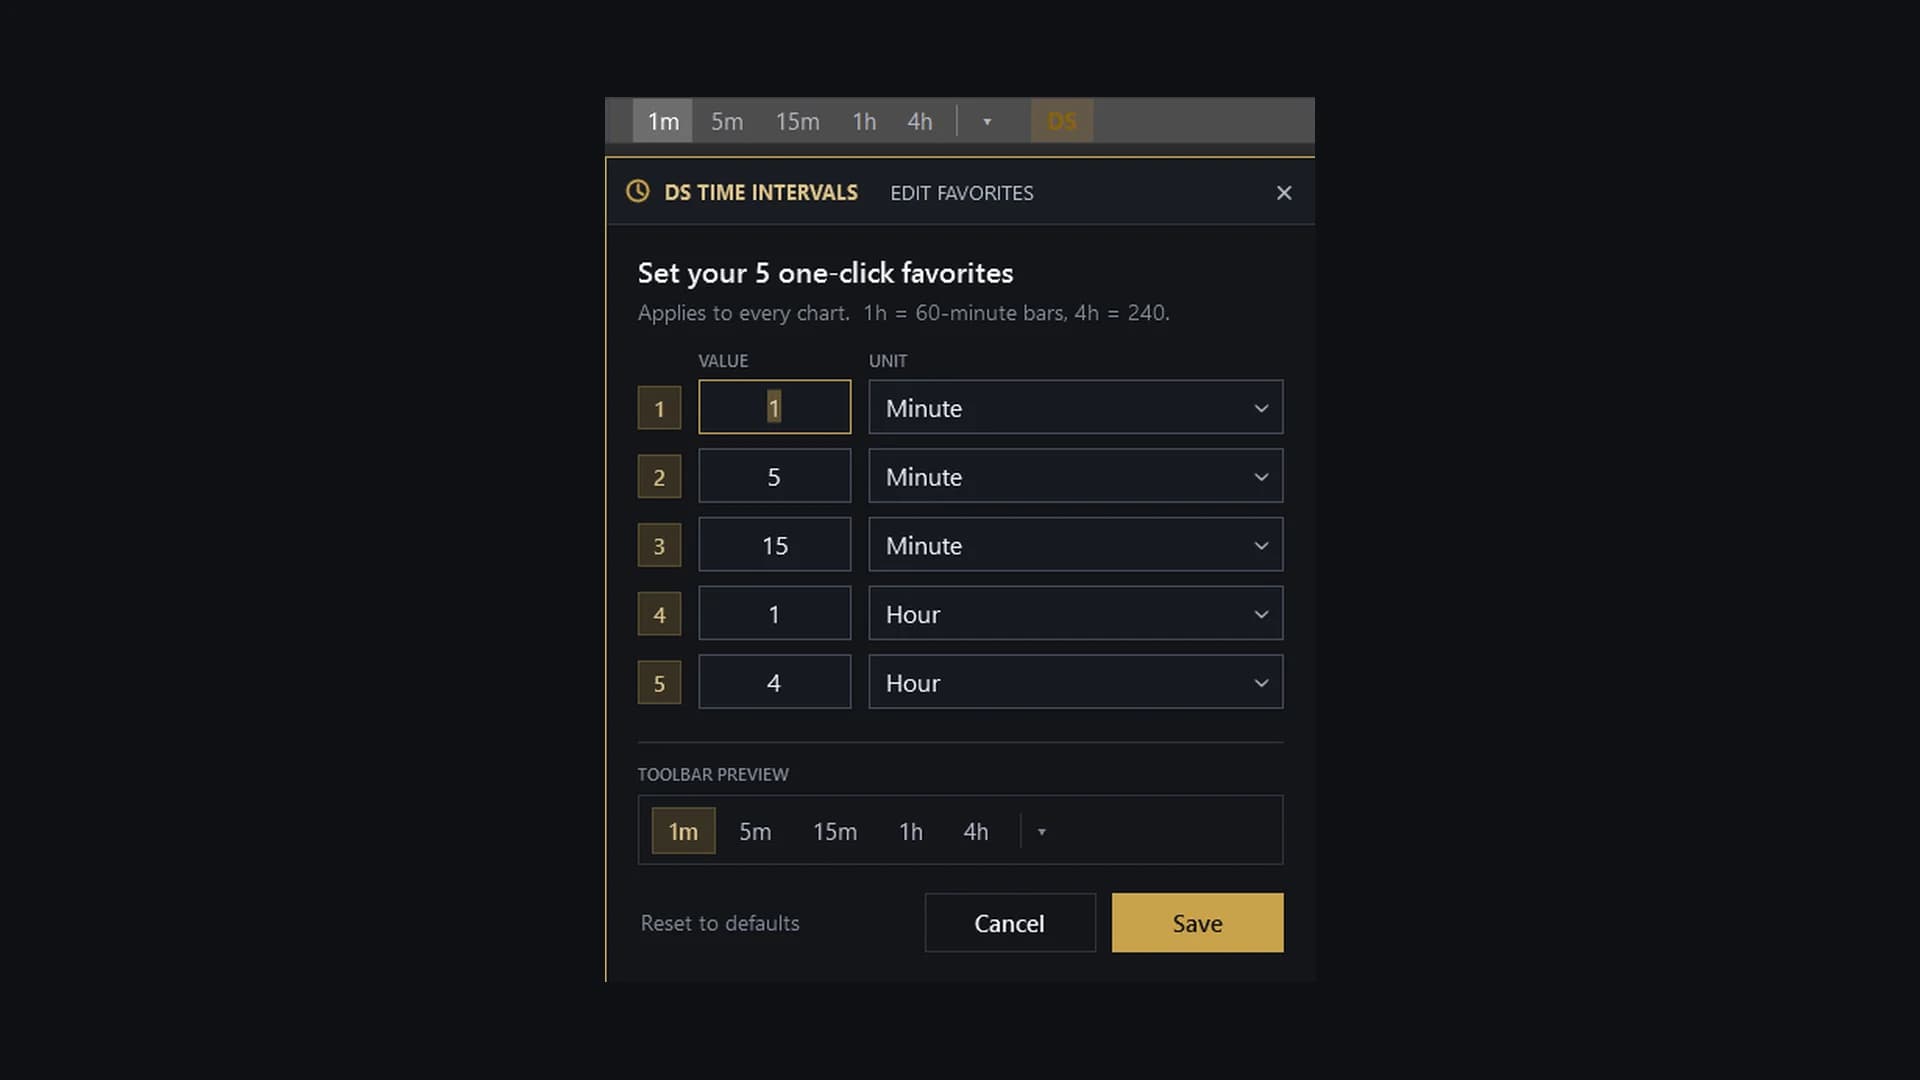
Workflow & Control
DS Time Intervals
A one-click timeframe bar on the top toolbar of every chart, so you switch periods without opening the native dropdown.
Learn more