DS Stochastics
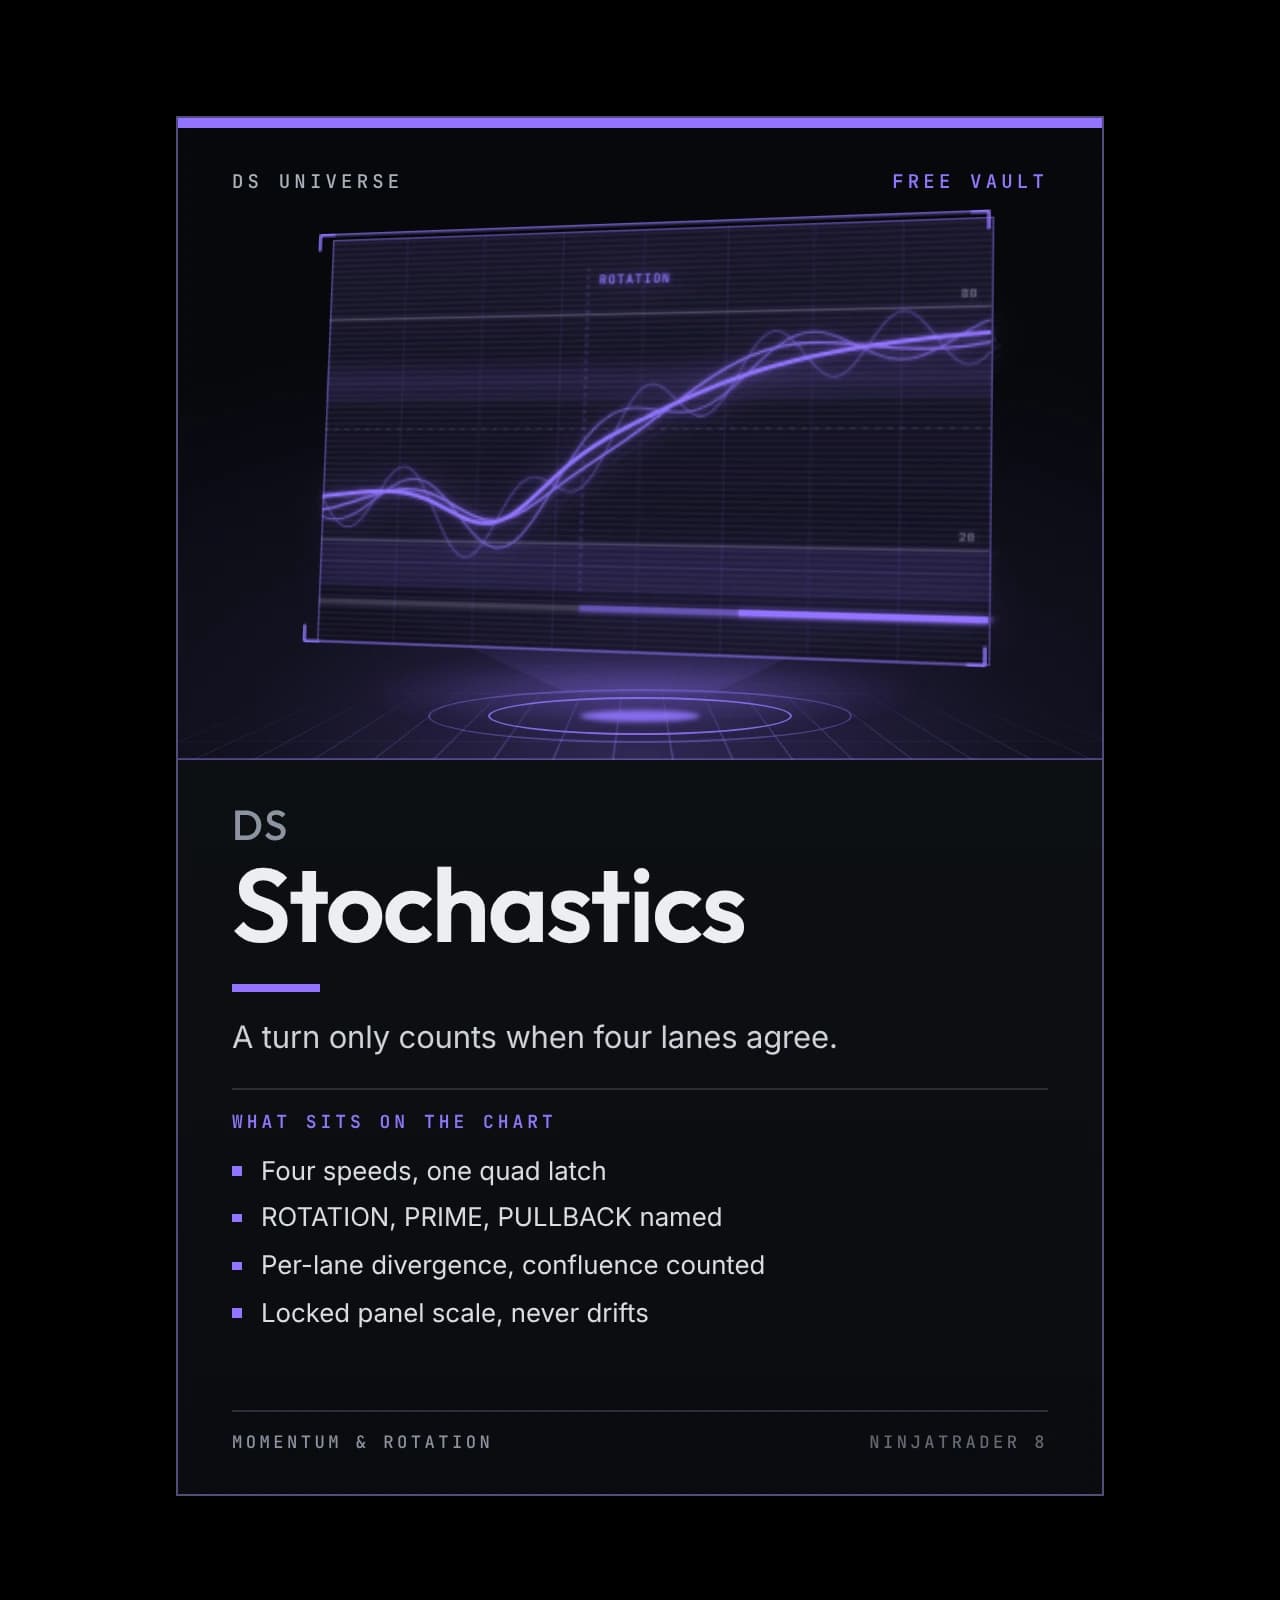
Four stochastics of four speeds in one panel, latching into ROTATION, PRIME and PULLBACK states so a real turn stands out from a lane that only wobbled.
- Four speeds, one quad latch
- ROTATION, PRIME, PULLBACK named
- Per-lane divergence, confluence counted
- Locked panel scale, never drifts
On the chart
Recording · 20 sA session playing out with DS Stochastics: four stochastic lanes rotate beneath price.
The recording and chart pictures above show the software running; they are not a performance record. Futures trading carries substantial risk of loss and is not suitable for every investor, and hypothetical or simulated results have inherent limitations that may differ materially from live trading. Risk disclosures.
- Type
- Indicator
- Series
- Free Vault
- Category
- Momentum & Rotation
- Platform
- NinjaTrader 8 · 8.1.8.1 or newer
- MarketsBuilt on NQ · MNQ
Any market NinjaTrader charts
- Futures — runs on it
- Stocks — runs on it
- Forex — runs on it
- Crypto — runs on it
Reads price only. A stochastic runs from 0 to 100 on every market, so nothing needs adjusting.
How it helps
One stochastic lane tells you overbought or oversold on one timescale and leaves you guessing whether that actually means anything. DS Stochastics runs four stochastics of four different speeds in the same panel and only calls a state when they agree: a quad latch arms when every lane sits at an extreme together, and from there ROTATION, PRIME and PULLBACK name exactly what kind of turn is unfolding — so a real rotation stands apart from a lane that simply wobbled.
At checkout, enter the email on your NinjaTrader account. The files are yours at once; the license is switched on by hand, so allow a short wait. See it on Whop
Its own download, free permanently. It is not part of DS Complete: it runs beside it. Everything in the Free Vault
DS Universe tools are charting and research software for educational and informational purposes. They are not investment advice and no output is a forecast or a guarantee of any result. Trading futures and other leveraged instruments carries substantial risk of loss and is not suitable for every investor.
In detail
One stochastic lane tells you overbought. Four lanes, latched together, tell you whether that means anything.
Fast, standard, slow and long stochastics share one panel, and a quad latch only arms when all four sit at an extreme at once.
From an armed latch
- ROTATION — the fastest lane turns back out of its extreme
- PRIME — that rotation carries a same-direction divergence with it
- PULLBACK — the slow lane holds a trend while the fast lane dips and turns
- Confluence count shows how many lanes agree, lane by lane
Divergence runs independently on every lane from confirmed pivots, marked on the panel and on the price chart. The panel's Y-axis locks, so a chart drag can never misalign the four lanes.
Closed-bar decisions throughout — it does not repaint.
Free — add it to a chart and all four lanes are there.

Test it on your own charts first.
Four screenshots and a paragraph are not enough to judge an indicator on. Watch it work in your own instrument, on your own timeframe, before it goes anywhere near a live account. Both ways of doing that are free.
- 01
Replay a session you have already seen
Market Replay runs a past session back tick by tick, at whatever speed you like. You get to watch DS Stochastics print in conditions you remember, and pause on the bars where it mattered.
- 02
Then trade it forward, on the simulator
Replay shows you the past with the ending already known. The simulator does not — it runs live, in real time, on real prices, with nothing at stake. That is where you find out whether you can actually act on what you are seeing.
A simulated fill is not a live fill. Replay and the simulator cannot reproduce real queue position, slippage, or what it feels like to hold a position with money on it, and results from either may differ materially from live trading. Test to learn how a tool behaves — not to estimate what it might return.
More in the vault