DS ProHeikinAshi
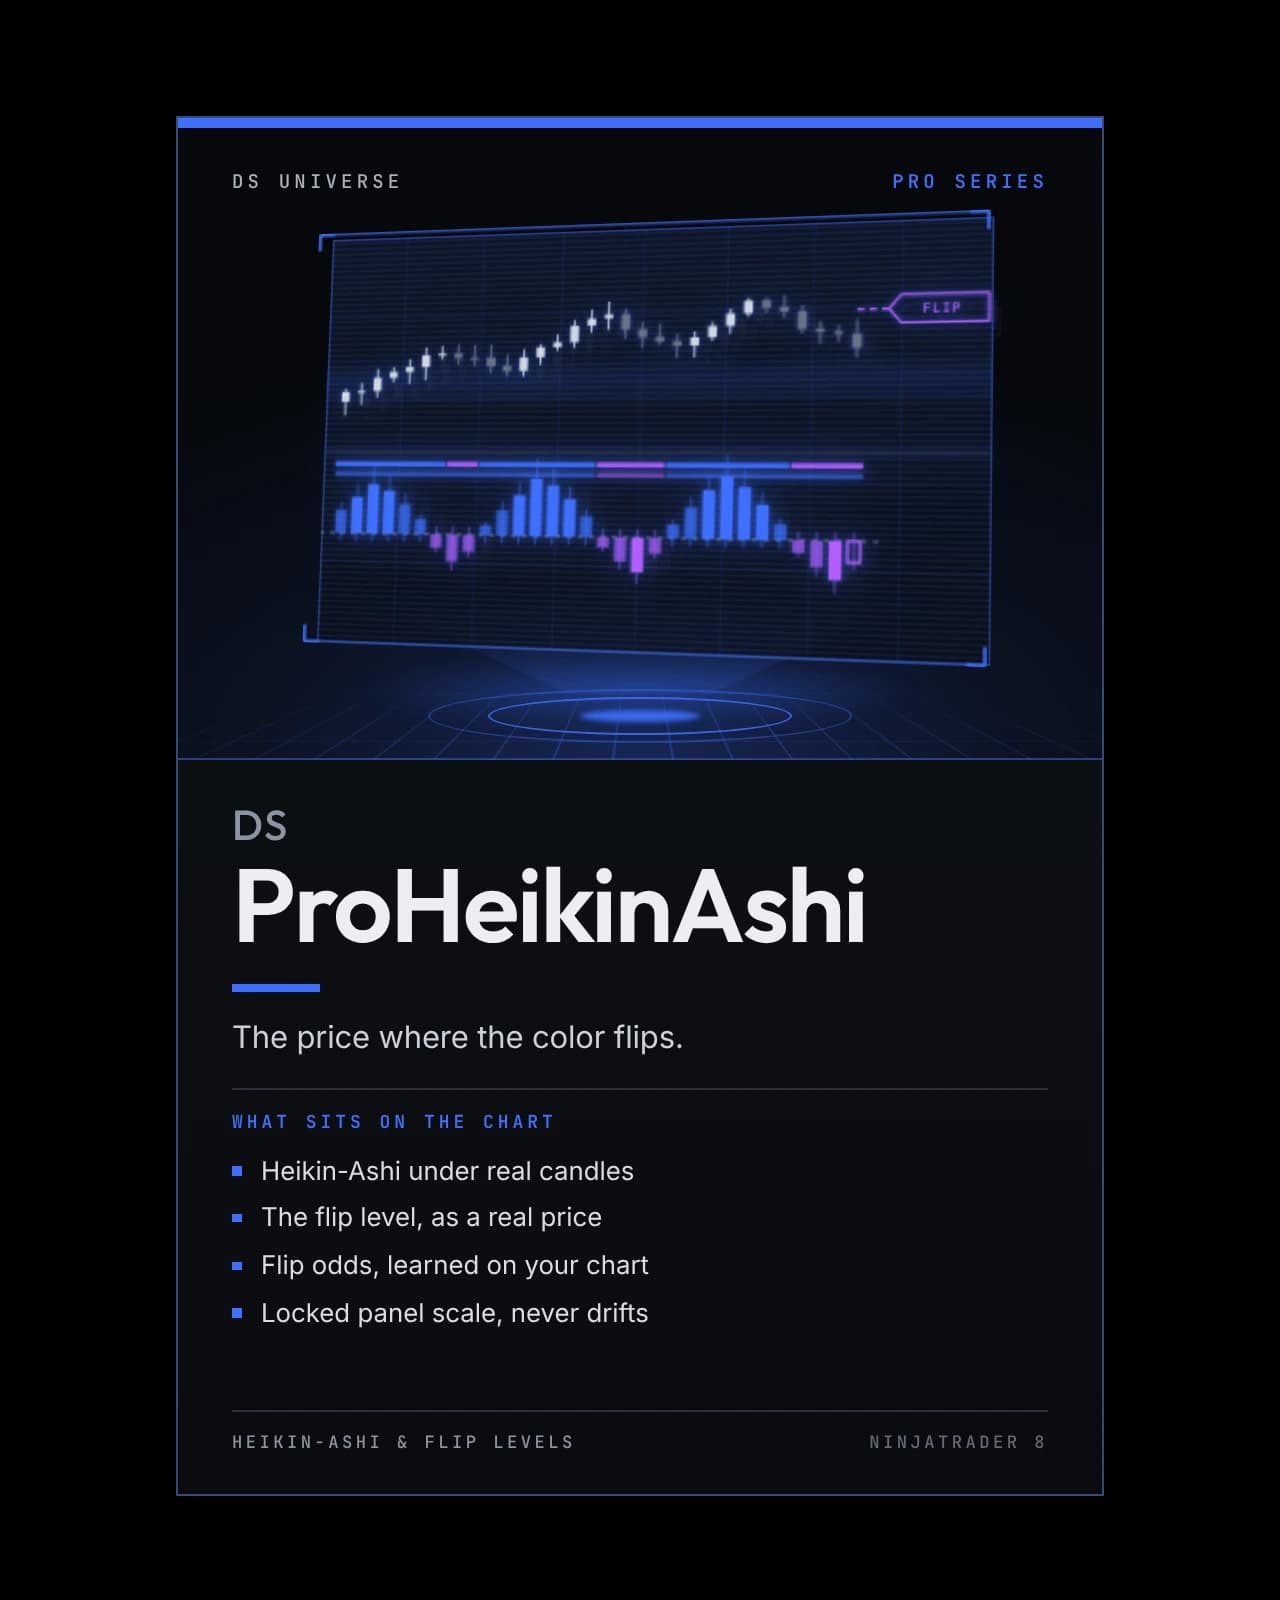
A Heikin-Ashi panel under your candlestick chart — every candle standing on its own open, the price at which its color flips drawn back on the price chart, and the measured odds that it flips on the next bar.
- Heikin-Ashi under real candles
- The flip level, as a real price
- Flip odds, learned on your chart
- Locked panel scale, never drifts
On the chart
Recording · 30 sA session playing out with DS ProHeikinAshi on a light chart: the panel's bars turn between teal and violet and the flip rails follow price.
The recording and chart pictures above show the software running; they are not a performance record. Futures trading carries substantial risk of loss and is not suitable for every investor, and hypothetical or simulated results have inherent limitations that may differ materially from live trading. Risk disclosures.
- Type
- Indicator
- Series
- Pro Series panels
- Category
- Heikin-Ashi & Flip Levels
- Platform
- NinjaTrader 8 · 8.1.8.1 or newer
- MarketsBuilt on NQ · MNQ
Any market NinjaTrader charts
- Futures — runs on it
- Stocks — runs on it
- Forex — runs on it
- Crypto — runs on it
Reads price only. The cushion is counted in the chart's own unit, so the same reading means the same thing on every instrument and timeframe. Use it on real bars: on NinjaTrader's Renko bars the cushion says little, and the panel says so.
How it helps
A Heikin-Ashi chart shows the trend and hides the price: its candles are averages, so no open, high, low or close on it is a price that traded. DS ProHeikinAshi leaves the candlestick chart as it is and draws the Heikin-Ashi candle in a panel under it, each candle standing on its own open so color and strength read at a glance. The level that decides the next candle's color is drawn back on the price chart as a real price, with the measured odds that the color flips on the next bar, and two higher-timeframe candles ride above as lanes — three Heikin-Ashi timeframes read without leaving the chart.
At checkout, enter the email on your NinjaTrader account. The files are yours at once; the license is switched on by hand, so allow a short wait. See it on Whop
Or take the whole paid lineup — DS Complete, every paid DS Universe product in one license — a $749.90 value, $374.95 in the Founders Sale.
DS Universe tools are charting and research software for educational and informational purposes. They are not investment advice and no output is a forecast or a guarantee of any result. Trading futures and other leveraged instruments carries substantial risk of loss and is not suitable for every investor.
Product guide
Every mark on the chart, explained
The annotated boards: a chart, with what each part of DS ProHeikinAshi shows laid out beside it. Open any board to read it at full size.
Read the alignment.
In detail
A Heikin-Ashi chart shows the trend and hides the price. Its candles are averages, so nothing on it is a price that traded.
DS ProHeikinAshi leaves your candlestick chart alone and draws the Heikin-Ashi candle in a panel under it, with the one thing a Heikin-Ashi chart cannot show: the price at which its color flips.
What the panel reads
- FLIP LEVEL — the price the next bar's average must finish beyond for the color to change, drawn on your price chart as a rail
- CUSHION — how far the close stands clear of it, in the chart's own unit: FLIP PENDING, HOLDING or FIRM
- FLIP ODDS — how often a candle with this cushion flipped on the next bar, from a measured table that then learns your chart
- Two higher-timeframe candles as lanes, built from the chart's own bars with no second data series
No length, threshold or sensitivity to tune. A Heikin-Ashi color describes the last few bars — measured, it did not say where price went next, and the panel is not a forecast. What can be measured is when the color ends.
Closed-bar decisions throughout — it does not repaint.

Test it on your own charts first.
Four screenshots and a paragraph are not enough to judge an indicator on. Watch it work in your own instrument, on your own timeframe, before it goes anywhere near a live account. Both ways of doing that are free.
- 01
Replay a session you have already seen
Market Replay runs a past session back tick by tick, at whatever speed you like. You get to watch DS ProHeikinAshi print in conditions you remember, and pause on the bars where it mattered.
- 02
Then trade it forward, on the simulator
Replay shows you the past with the ending already known. The simulator does not — it runs live, in real time, on real prices, with nothing at stake. That is where you find out whether you can actually act on what you are seeing.
A simulated fill is not a live fill. Replay and the simulator cannot reproduce real queue position, slippage, or what it feels like to hold a position with money on it, and results from either may differ materially from live trading. Test to learn how a tool behaves — not to estimate what it might return.
From the same series
Pro Series panels