DS ProLiquidityHunter
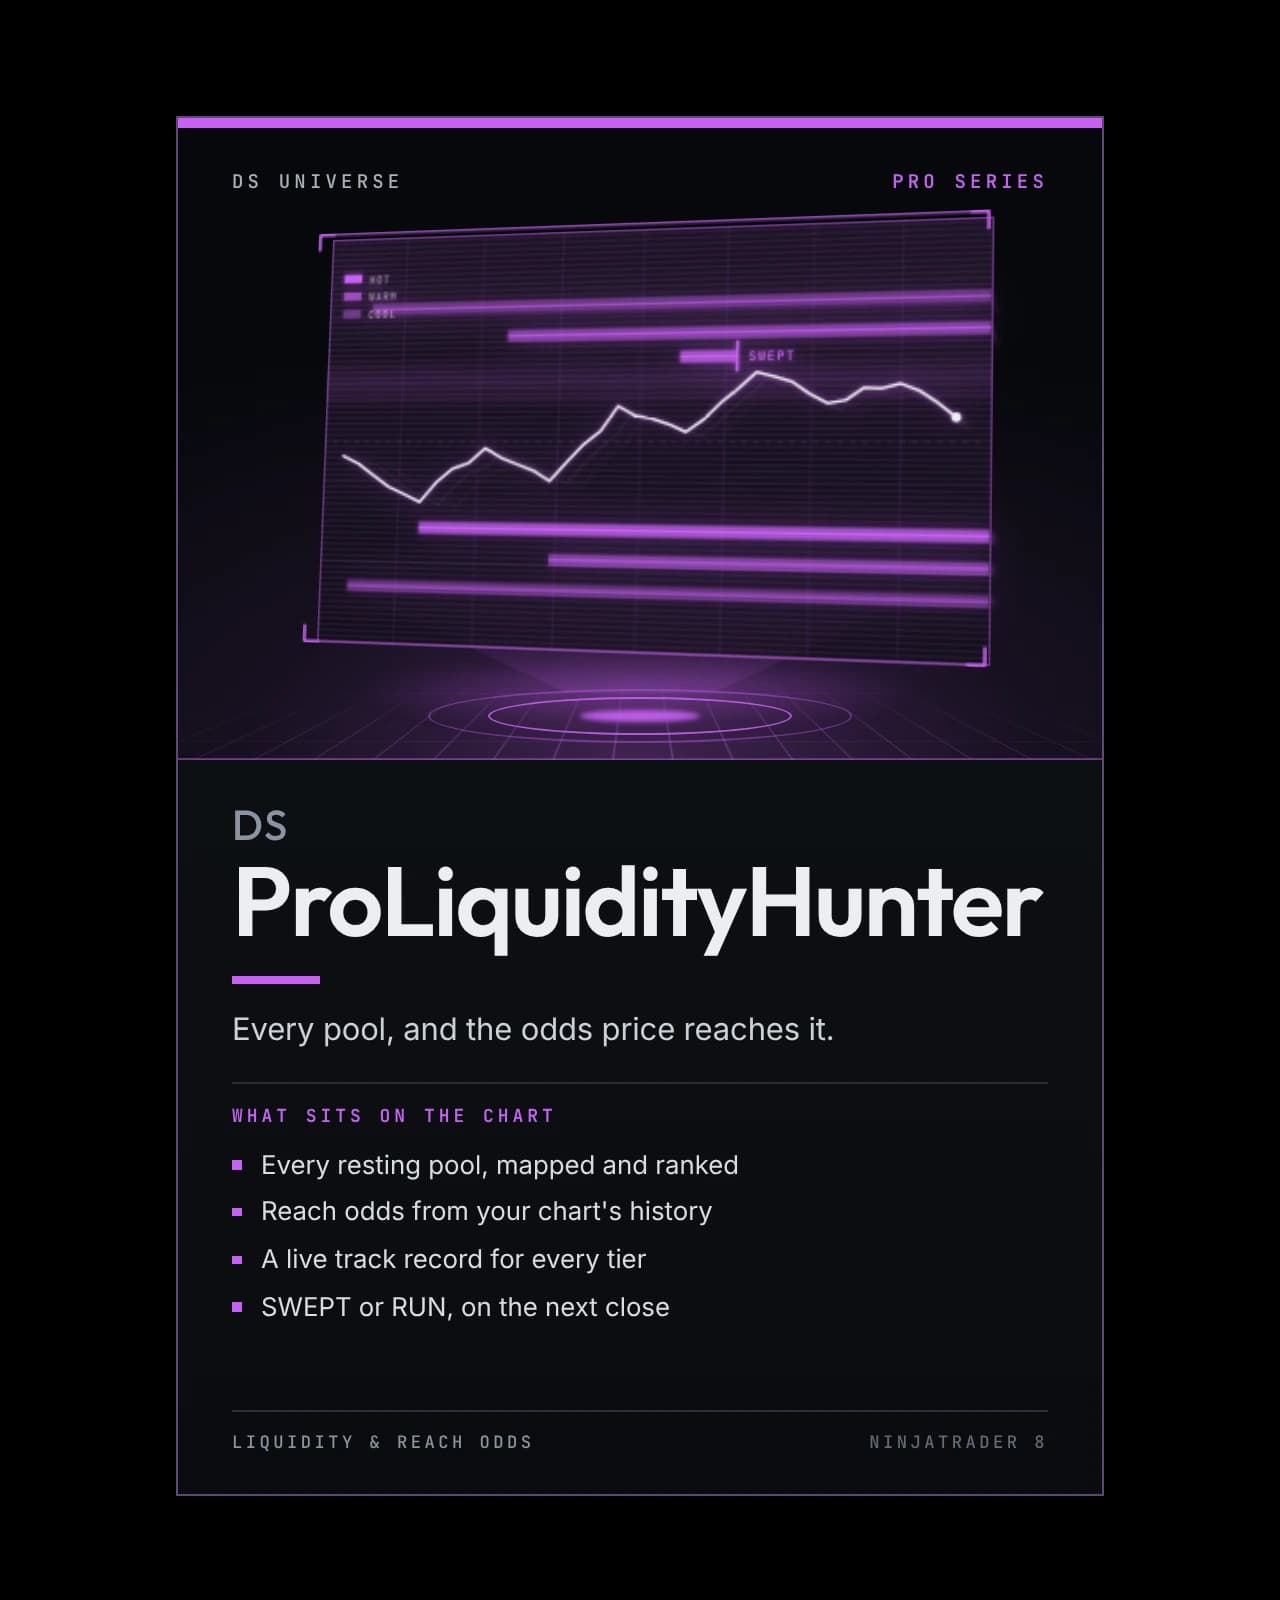
A liquidity map with a track record — every swing high and low price has left behind drawn as a pool, heated by the measured odds that price reaches it within the horizon, and scored against what happened next on your own chart.
- Every resting pool, mapped and ranked
- Reach odds from your chart's history
- A live track record for every tier
- SWEPT or RUN, on the next close
On the chart
Recording · 30 sA session playing out with DS ProLiquidityHunter: pools build over the highs and under the lows, and the odds ladder beside the panel re-ranks them as price moves.
The recording and chart pictures above show the software running; they are not a performance record. Futures trading carries substantial risk of loss and is not suitable for every investor, and hypothetical or simulated results have inherent limitations that may differ materially from live trading. Risk disclosures.
- Type
- Indicator
- Series
- Pro Series panels
- Category
- Liquidity & Reach Odds
- Platform
- NinjaTrader 8 · 8.1.8.1 or newer
- MarketsBuilt on NQ · MNQ
Any market NinjaTrader charts
- Futures — runs on it
- Stocks — runs on it
- Forex — runs on it
- Crypto — runs on it
Reads price only. Pools are sized by the average true range and the heat tiers are probabilities, so both mean the same thing on every instrument, timeframe and bar type.
How it helps
Every liquidity tool draws the same thing — the highs and lows price left behind — and most stop there. DS ProLiquidityHunter adds how likely price is to go back for each one: every pool carries the measured odds that price trades to it within the horizon, read from your own chart's history and adjusted for the time of day, and the panel scores those odds against what happened next, in its header. When a pool is taken, the next close says whether it was SWEPT or RUN. You see where the liquidity is and what it would take to get there.
At checkout, enter the email on your NinjaTrader account. The files are yours at once; the license is switched on by hand, so allow a short wait. See it on Whop
Or take the whole paid lineup — DS Complete, every paid DS Universe product in one license — a $749.90 value, $374.95 in the Founders Sale.
DS Universe tools are charting and research software for educational and informational purposes. They are not investment advice and no output is a forecast or a guarantee of any result. Trading futures and other leveraged instruments carries substantial risk of loss and is not suitable for every investor.
Product guide
Every mark on the chart, explained
The annotated boards: a chart, with what each part of DS ProLiquidityHunter shows laid out beside it. Open any board to read it at full size.
Map the untouched extremes.
In detail
Every liquidity tool draws the highs and lows price left behind. This one also says how likely price is to go back for each — and keeps score.
Every swing extreme price has not traded back through is mapped as a pool, over a line-on-close view of price, and heated by the measured odds that price reaches it within the horizon — odds read from your own chart's history.
What the panel reads
- POOLS — buy-side over the highs, sell-side under the lows, stacked when they coincide and ranked LOCAL, SWING or MAJOR
- ODDS — COOL from 5%, WARM from 25%, HOT from 60%: probabilities, the same on every chart, with nothing to tune
- TRACK RECORD — how often each tier was taken within the horizon, measured on the chart in front of you
- SWEPT or RUN — the verdict on a taken pool, given on the next close; a swept MAJOR pool is marked on price
It measures reach — distance and time — and marks a precisely defined event. It does not see resting orders, and it is not a forecast of direction. It reads price only, on any instrument, timeframe and bar type.
Closed-bar decisions throughout — it does not repaint.

Test it on your own charts first.
Four screenshots and a paragraph are not enough to judge an indicator on. Watch it work in your own instrument, on your own timeframe, before it goes anywhere near a live account. Both ways of doing that are free.
- 01
Replay a session you have already seen
Market Replay runs a past session back tick by tick, at whatever speed you like. You get to watch DS ProLiquidityHunter print in conditions you remember, and pause on the bars where it mattered.
- 02
Then trade it forward, on the simulator
Replay shows you the past with the ending already known. The simulator does not — it runs live, in real time, on real prices, with nothing at stake. That is where you find out whether you can actually act on what you are seeing.
A simulated fill is not a live fill. Replay and the simulator cannot reproduce real queue position, slippage, or what it feels like to hold a position with money on it, and results from either may differ materially from live trading. Test to learn how a tool behaves — not to estimate what it might return.
From the same series
Pro Series panels